-609.60 loss!! -61%
At 5:30 we had a sharp upward trend that closed the overnight gap from yesterday’s close. Then at 6 am we kept trading, making the gap close. Open was at 3818.50 which was the value area low from yesterday. Lower value was rejected from overnight lower value. The first minute candle was the low of the session, with a range of 7 points. The second one-minute candle also came back down to the open price of 3818.50 but did not venture lower.
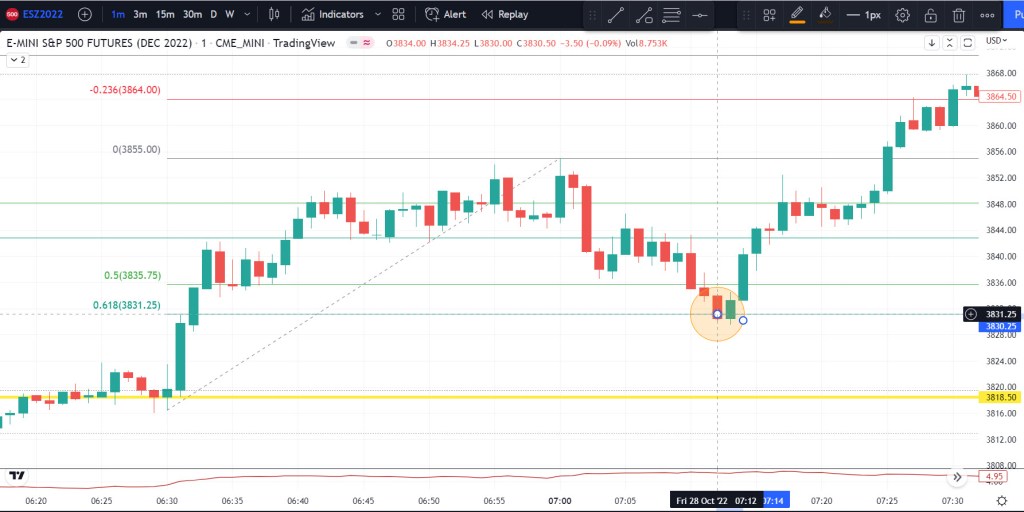
If you missed the entry at the bell you could have entered a long at .618 at 7:12. A 2 point stop loss would have kept you in the trade.
My trades:
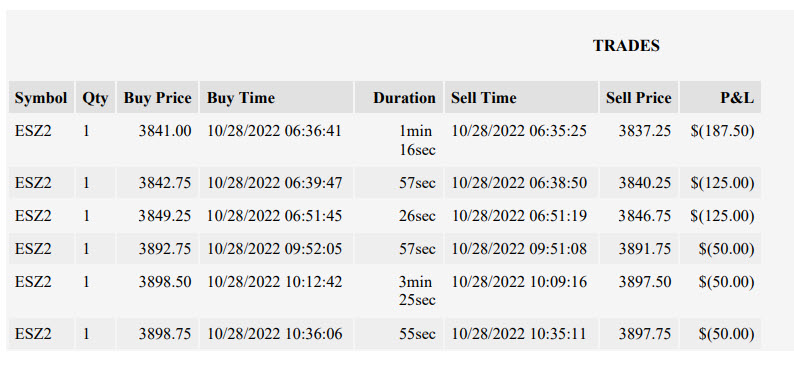
First trade entered at 6:35 based on the pull back and stacked imbalances in the candle at 6:34 (see below).
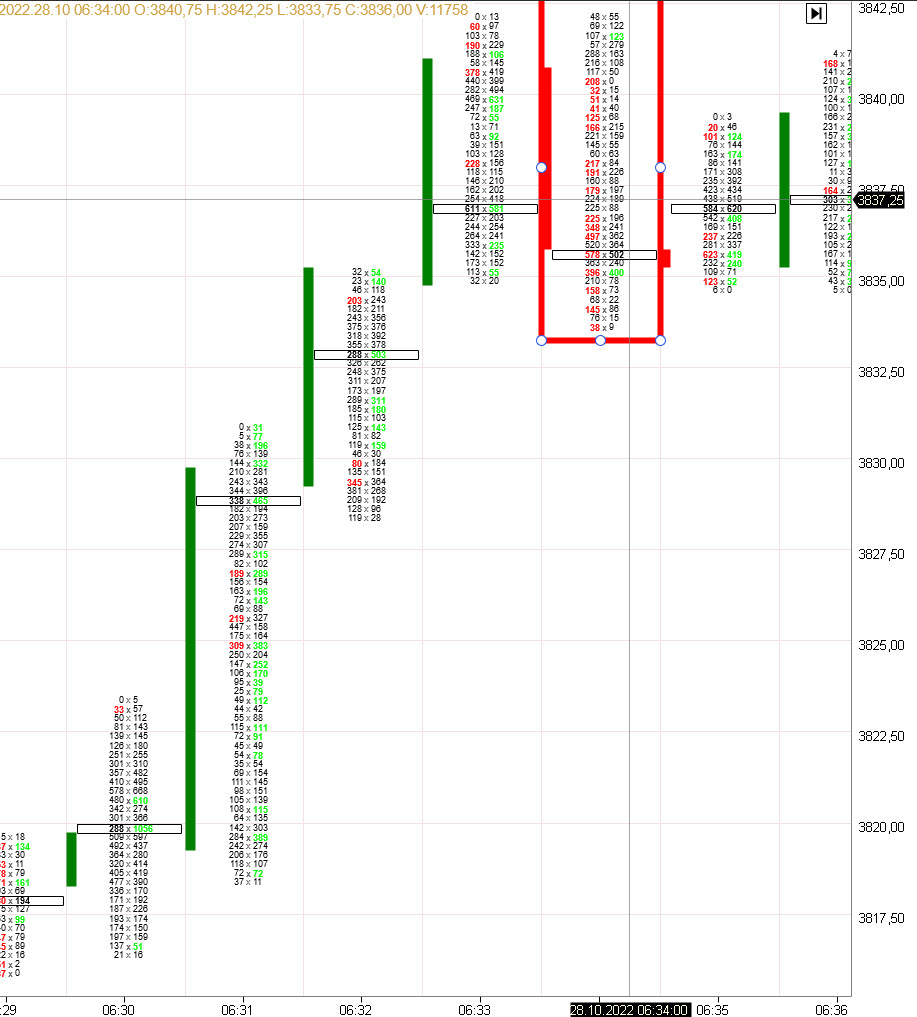
Next entry also in the same pullback at 3840.25 at 6:38 candle which got stopped out right away too.
Following is an idea for a pullback trade from a high at, 6855. Once the pullback reached 50% retracement, a short was possible with a 1 point stop loss to about -.236 at which point we could have taken the win or waited. Once the price came back up to 50% level we should have gone long. The circle is from prior trade. Short entry should have been at 3846.
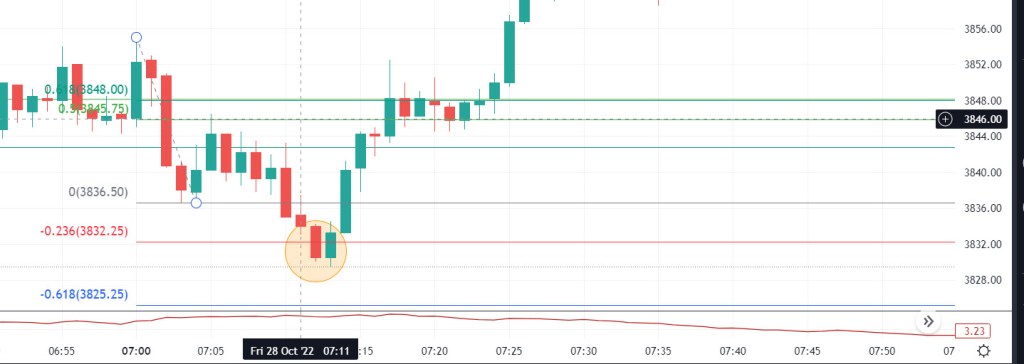
My next trade was an entry short at, 3846.75 Got stopped out in the same candle.
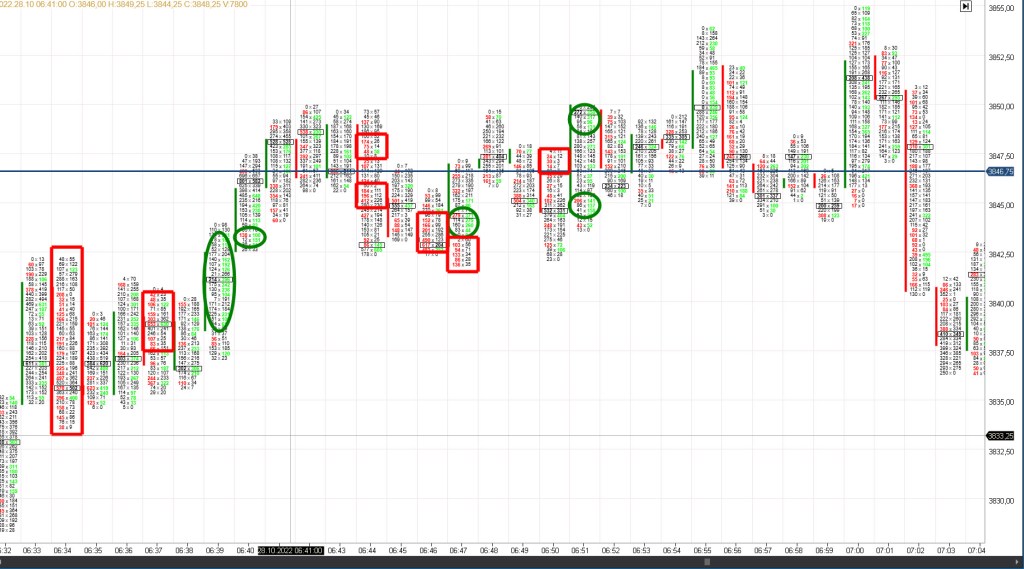
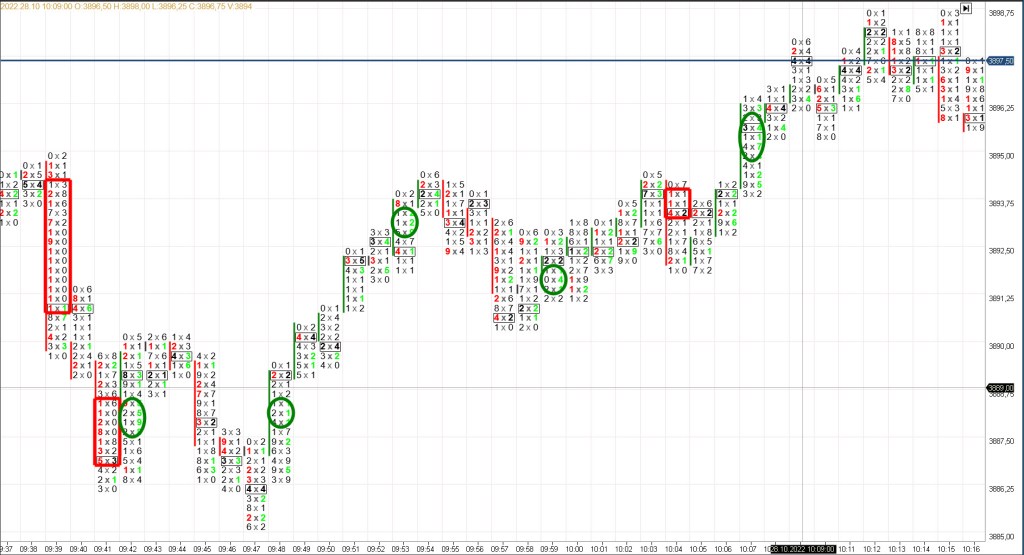
The next trade indicated a very big stacked imbalance at 9:39 for a short:
I entered this trade at 9:51, 12 minutes later! This could have also been a fib retracement:
By the time I entered the trade, at 9:51 I was already past the .618 fib retracement making this trade not working and indicating a further uptrend.
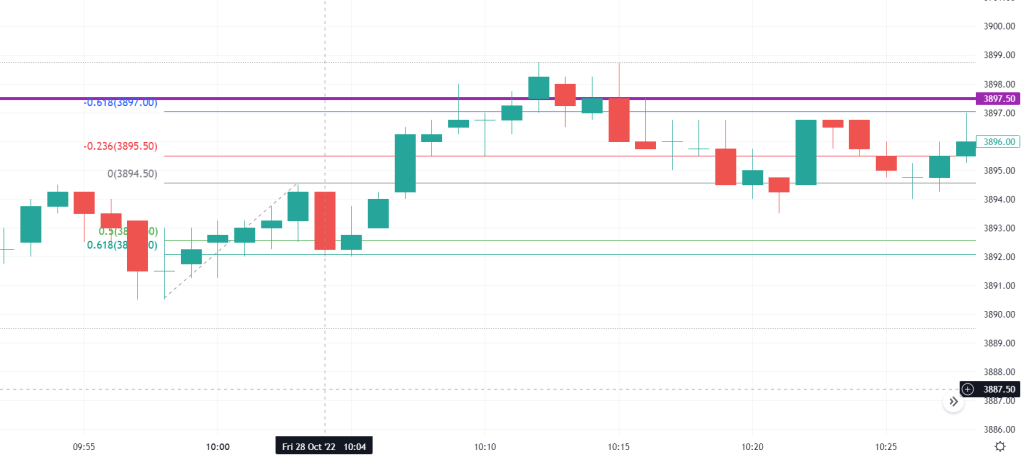
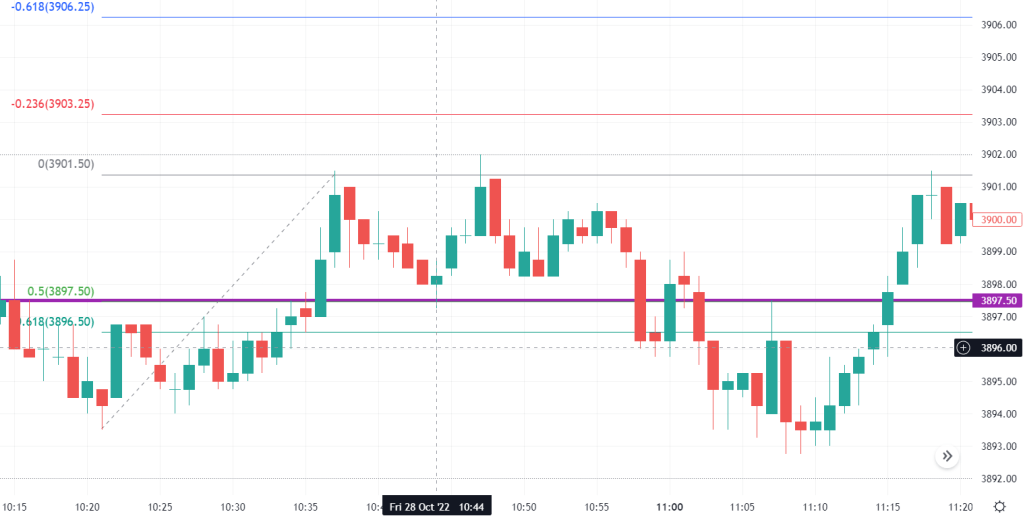
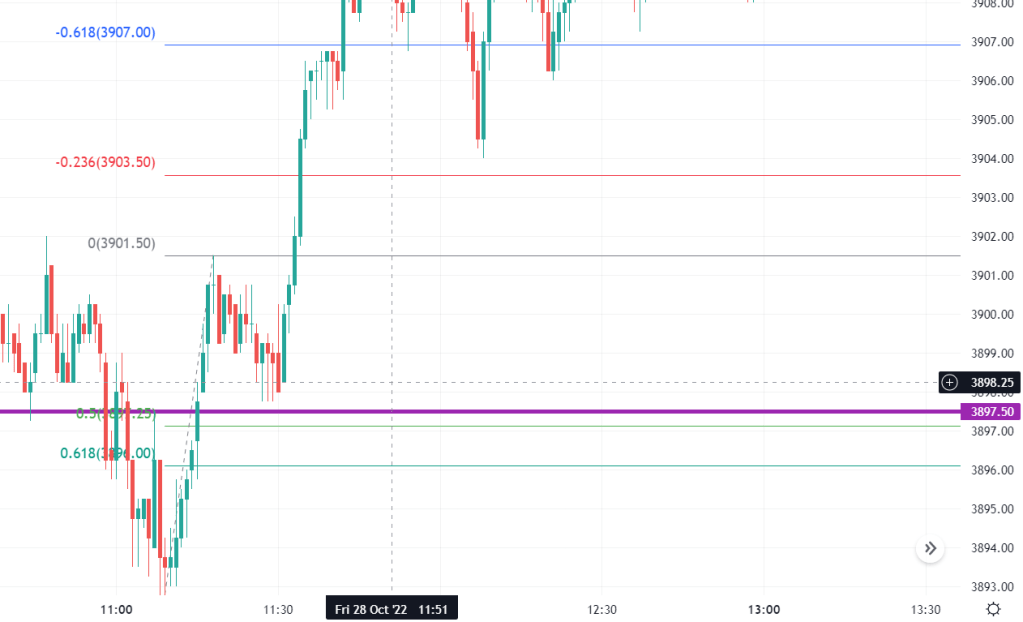
I entered next trade at 10:09 at 3897.5 short hoping that the excess high from 10/26 will hold but it did not.
Since it was such a major level, price rested here for over 3 min but eventually went past it. the blue horizontal line was my entry.
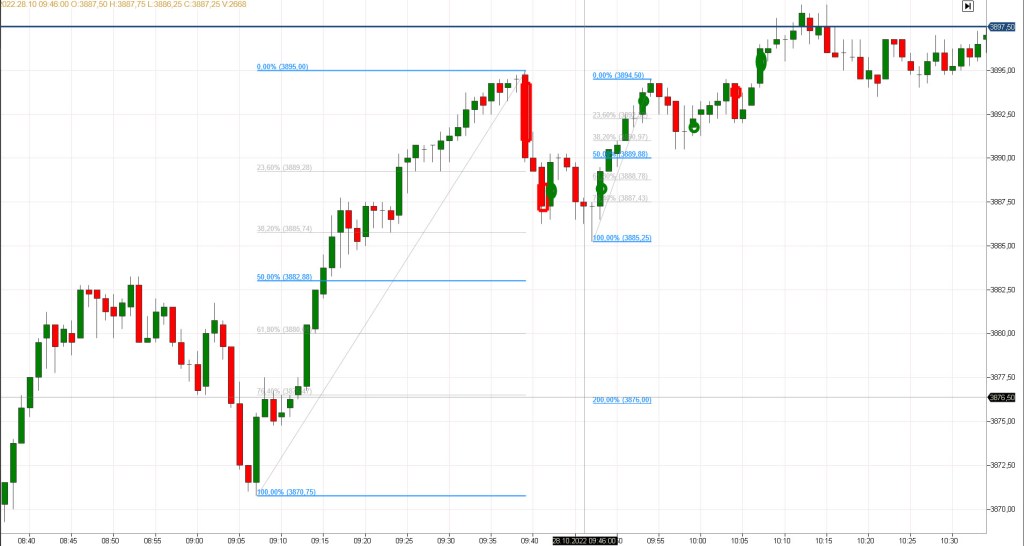
The fibonacci retracements of the prior hour and half never made it even down to the 50% level indicating there are still buyers in control
The last trade was another extension of this trade, a mere hope that this level at 3897.5 would hold.
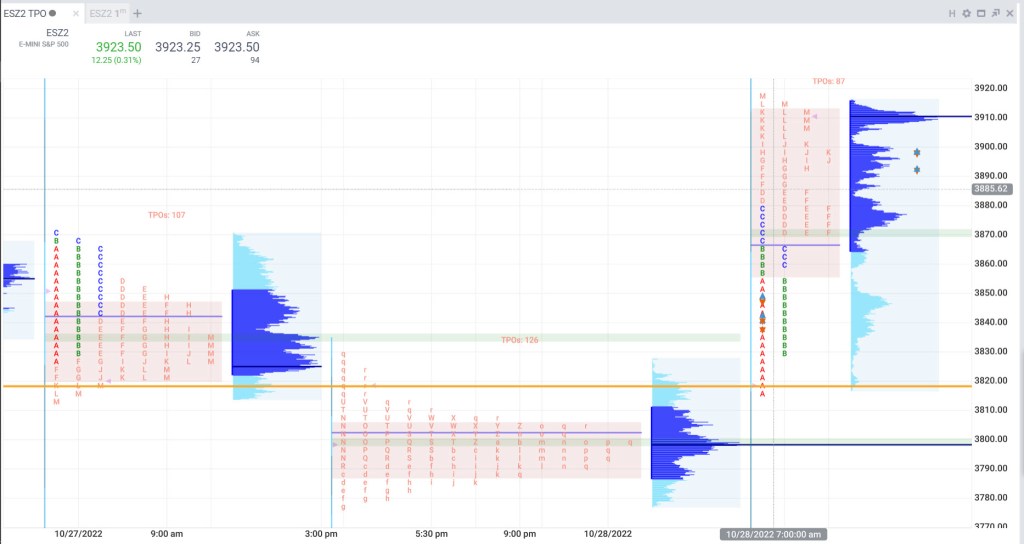
Eventually, the value was established higher with POC at 3871!
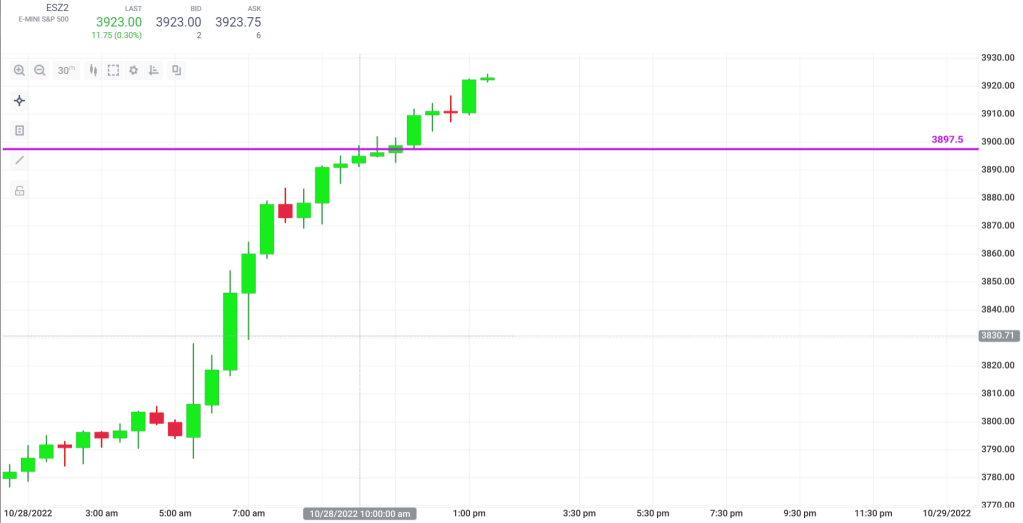
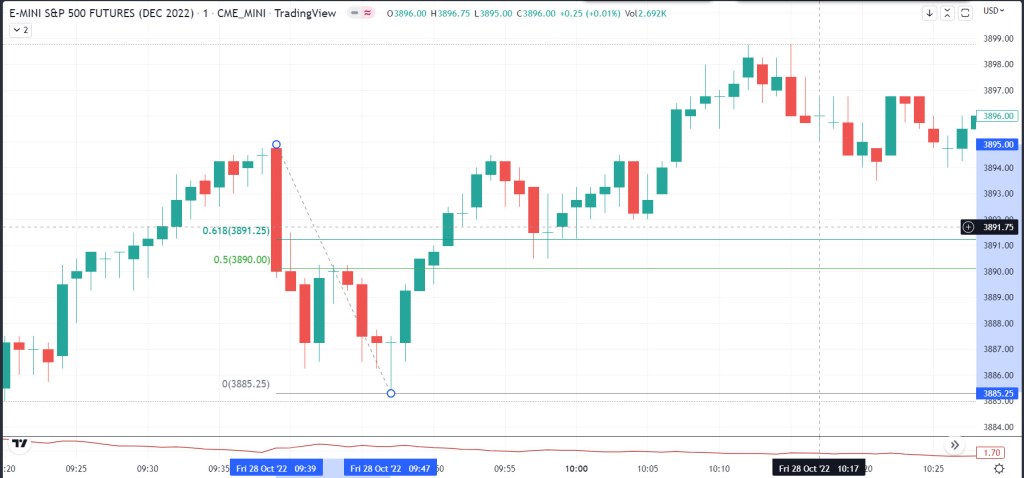
3897.5 was an excess high established on 10/26. The question on 10/28, a very emotional trend day already if price will reach and go beyond that level or will price fade this level. Price first peeked above that level at 10:09 am
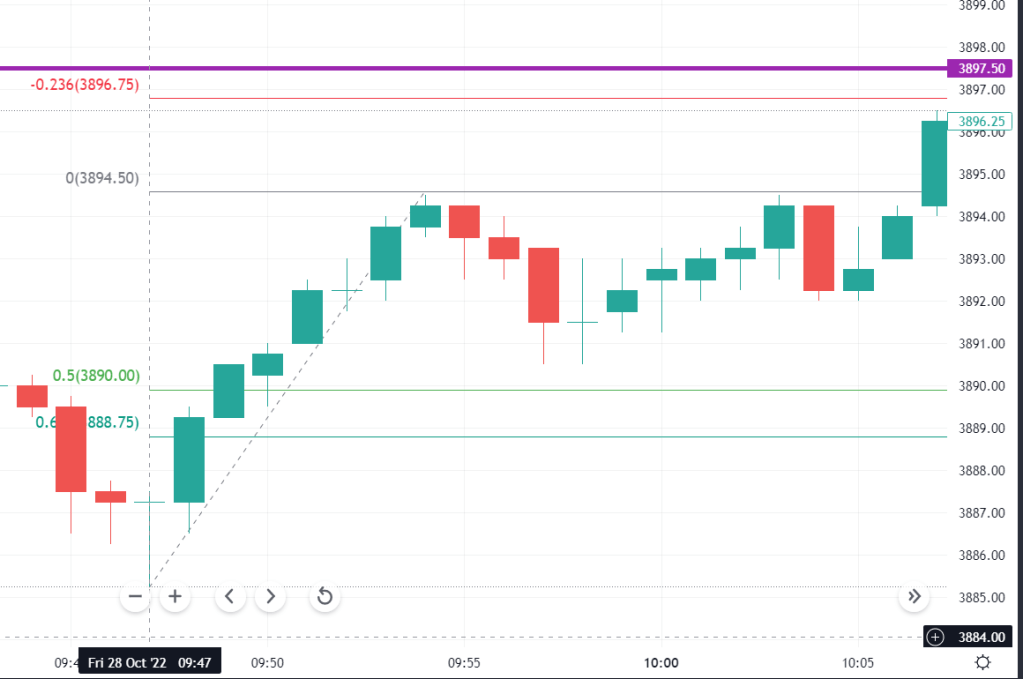
Fibonacci retracement did not even reach the 50% retracement leading up to the 10:09 minute and therefore would have made a halfback trade impossible. A fibonacci retracement to the .618 level was possible at 10:04 (see below). Alternatively, the trade could have been entered at the .5 level with the .618 level as a stop loss only .5 points lower. A one point stop loss would have been sufficient. We could have exited the trade at -.618 extension or added another point due to this being an emotional point and the possibility buyers will push it even a higher.
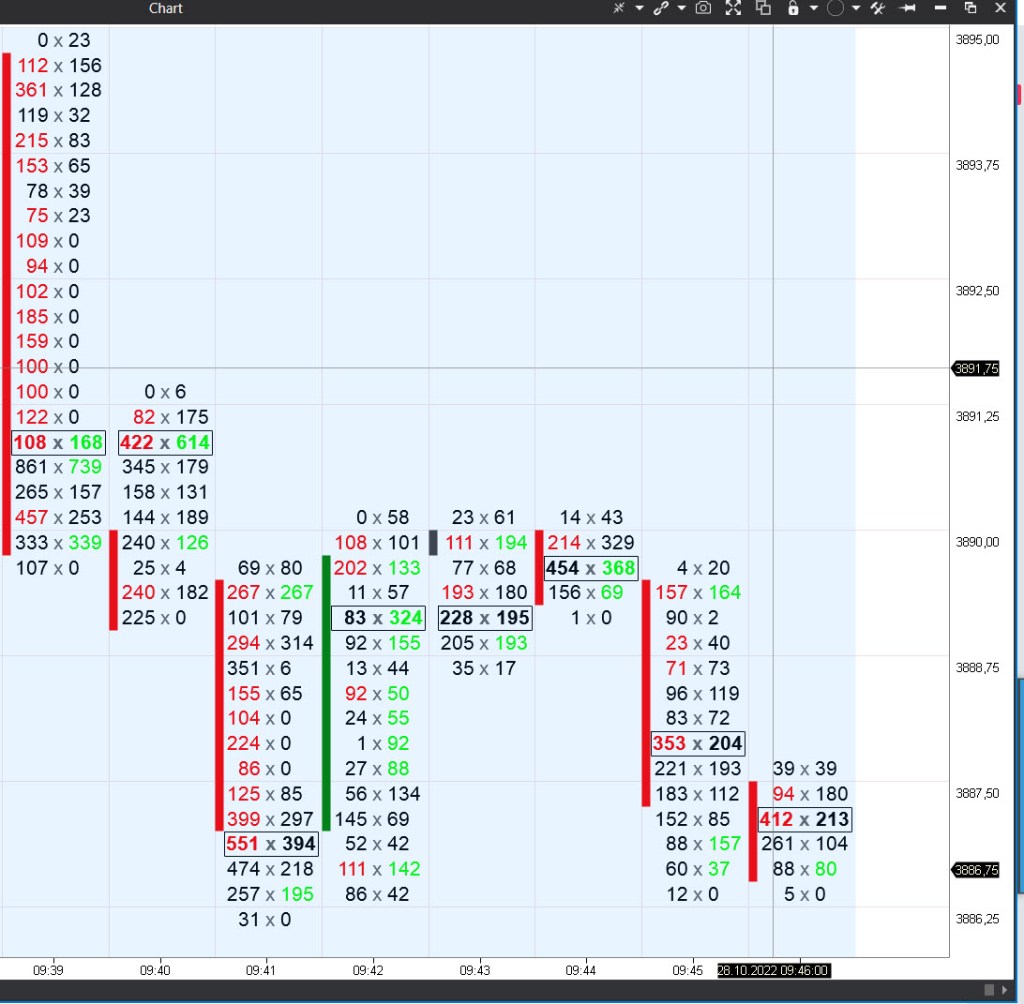
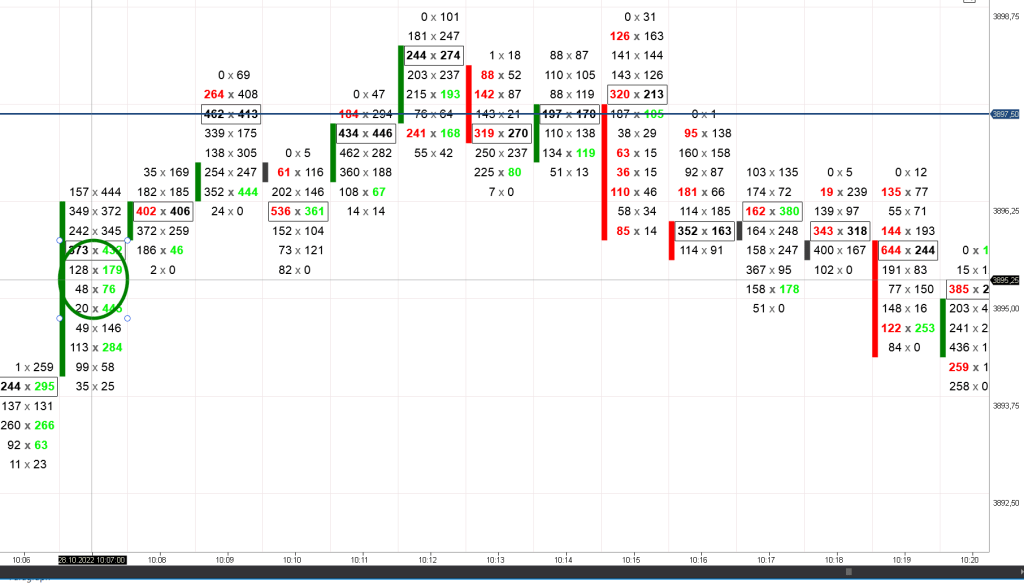
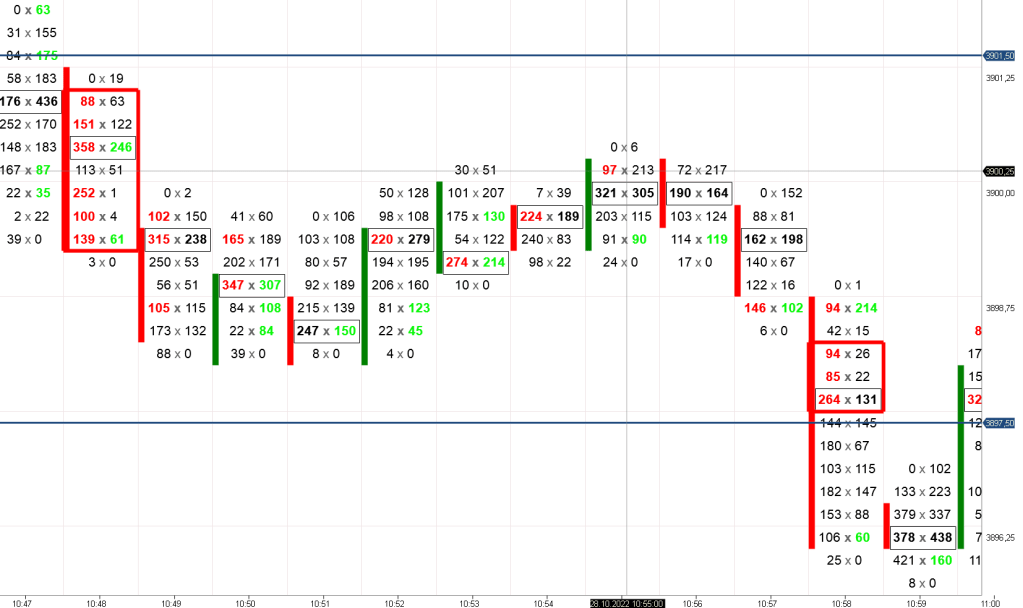
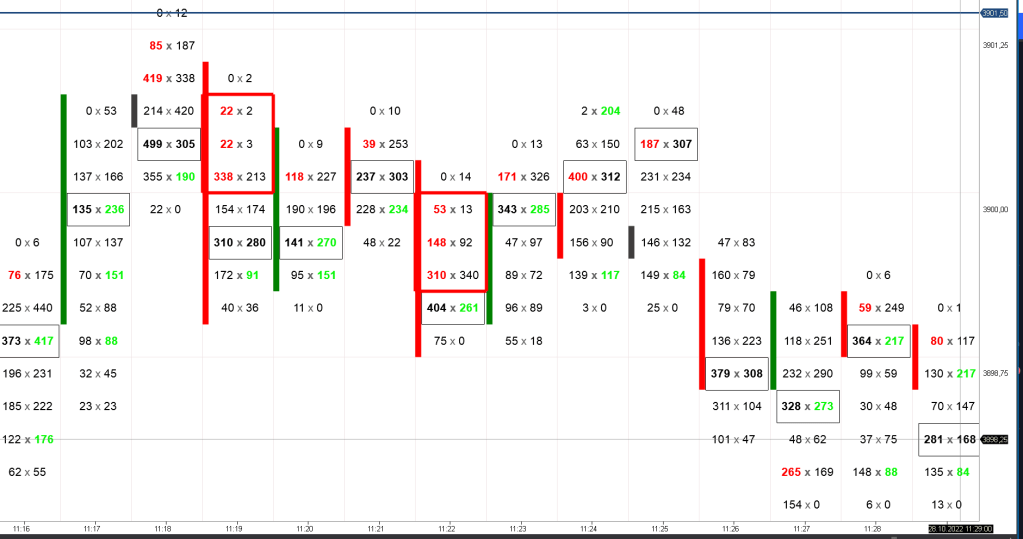
The following stacked imbalance in the footprint chart at 3895.25 gave confidence the 3897.5 level will be reached and exceeded.
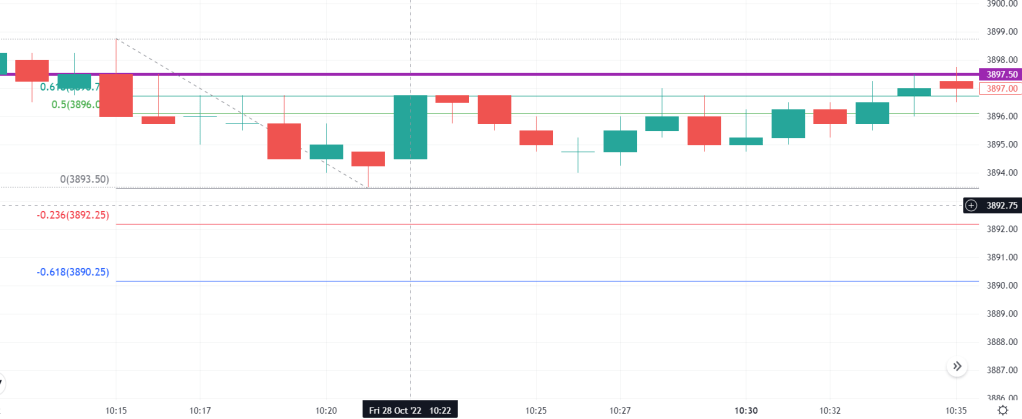
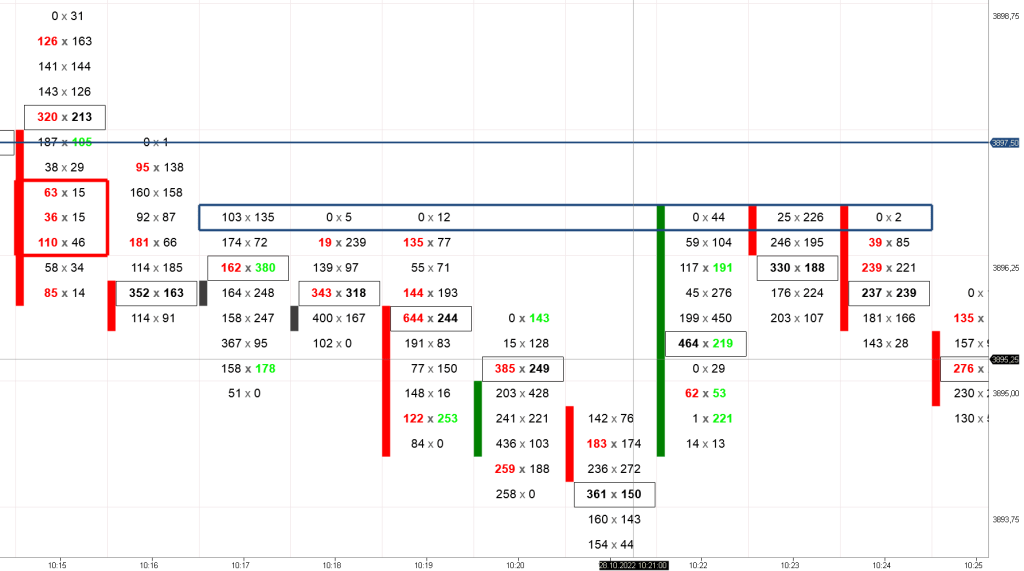
Once price left that area and went below 3897.5 at the 10:17 candle, we could have looked for a short entry at retracement. The retracement level for .5 could have been entered at 10:22,10,23,10:24 at the 3896 level with a stop loss set at .618 level .5 points higher or .75 points to give it some room. The footprint chart below shows that the .618 retracement level was reached exactly (blue rectangle) many times. This exactness is an indication that this price level is weak and will be revisited in the future, at which point we should have probably exited the trade. You can also see that the baseline was not reached, indicating continued buyer presence.
The footprint chart only shows one stacked imbalance on the sell side, which is normal for the start of a retracement, even in an upward trend. We got stopped out of this trade and should have started looking for an entry into a long trade after 10:28 candle. Buyers are still present.
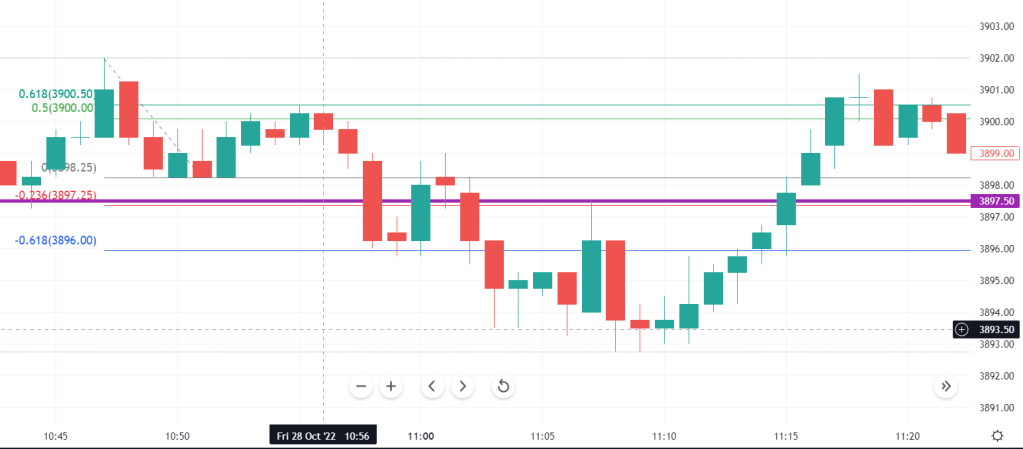
The next long trade would have been entered at the .5 level (which was exactly 3897.5) at 10.44 with the .618 as a stop loss (only one point).
The footprint chart below shows strong seller presence at 10:38 which is normal at the beginning of a retracement. The second, much larger stacked imbalance at 10:48 and very close to baseline should have given us some thought. We should have exited the trade here.
Once we know that this long has not worked, it would be time to look for another short or wait for further indication that buyers are taking over. Since we are still very close to our pivotal levele of 3897.5 the battle has not been decided yet. It is best to keep an open mind whether sellers are about to change the course of the auction that has been trending up since the beginning of the trading day. As it happens, the stacked imbalance above and the .5 retracement are a perfect entry point for a fib retracement to the downside. The .618 retracement could have figured as a stop loss.
The last bigger opportunity arose when price went up at 11.10 Assuming that the decision was not made if sellers are taking over it now looked like buyer took control again after our last short trade. Waiting for a retracement would have been prudent. However, price never came down to the .50 retracemnt level indicating strong buyer presence. The 3897.5 seem to have acted as a support level though since price did not reach in three consecutive candles. This would have been the moment to enter a long trade with 3897.5 as a stop loss.
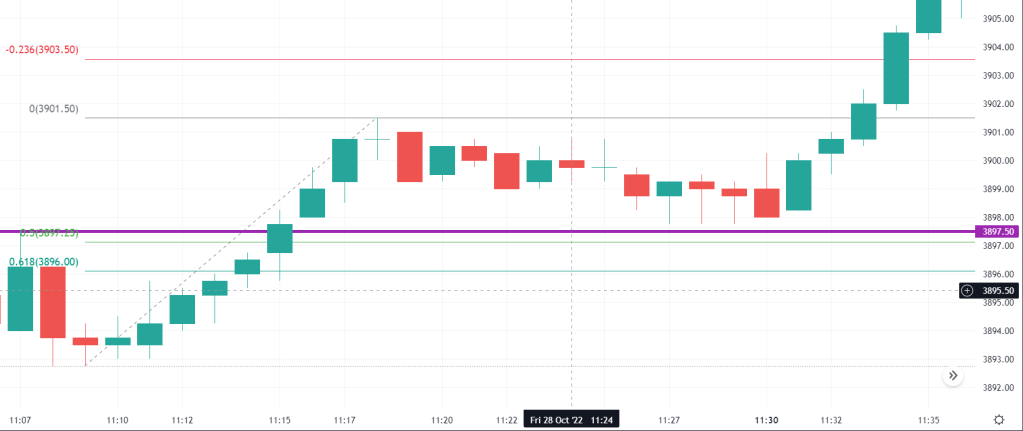
The footprint chart cluster shows that retracement starts again with a stacked imbalance, which is normal. TO enter this trade before the 50% retracement would have been extremely hard. We could have looked at the POC on the footprint chart and used those as an indicator. POC was going down at first but once it gets within .5 points of the 50% and the stop loss can be set at the .618 level this is a possibility. It is important to look for stacked imbalances in the candles that follow and for price to not get close to the pivotal level again, otherwise, we should abort.
We could have ridden this long until the end:
According to Dalton this was a short covering ralley with low volume.
