After finding an entry, confirmation is key to enter the trade with more peace of mind and letting it run. Sometimes, it is also helpful to expand the stop loss just a little bit with a confirmation as evidence. Always watch out for a change in the perception of value, though, as new information is priced in on an ongoing basis.
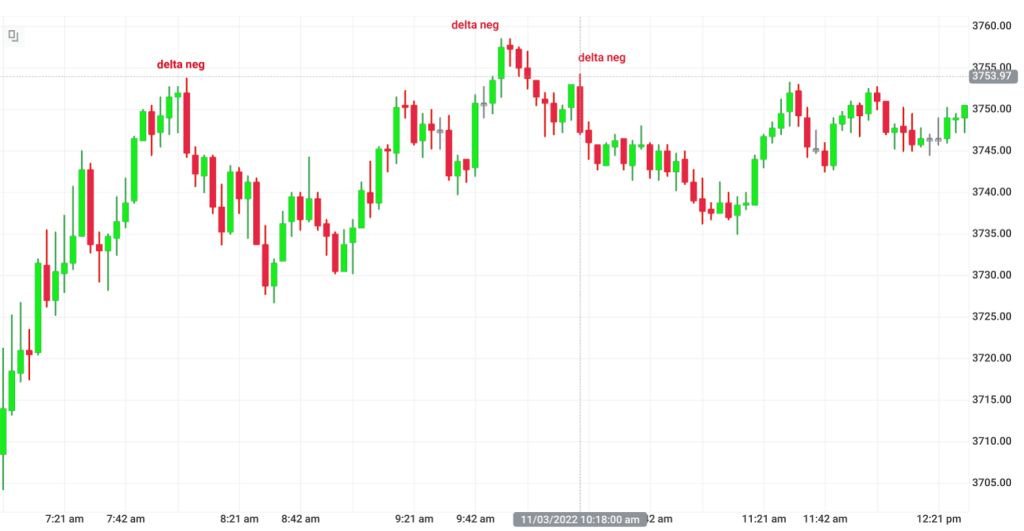
1. Delta Turnaround. This confirmation strategy is helpful when trading has been going on for a while already on the day timeframe and there is sufficient trading going on (range at least 50) . In the Atas software, you can find the appropriate timeframe where the delta turnaround lines up with the candles, where a change in either direction has already taken place before. In the next step, when you see a potential change materialize, use the delta turnaround for your candle as confirmation to enter the trade. Example at the end of this article here:
https://martin.travel.blog/2022/11/03/11-03-thursday/
The red arrows from above correspond to the candles labeled delta neg below.
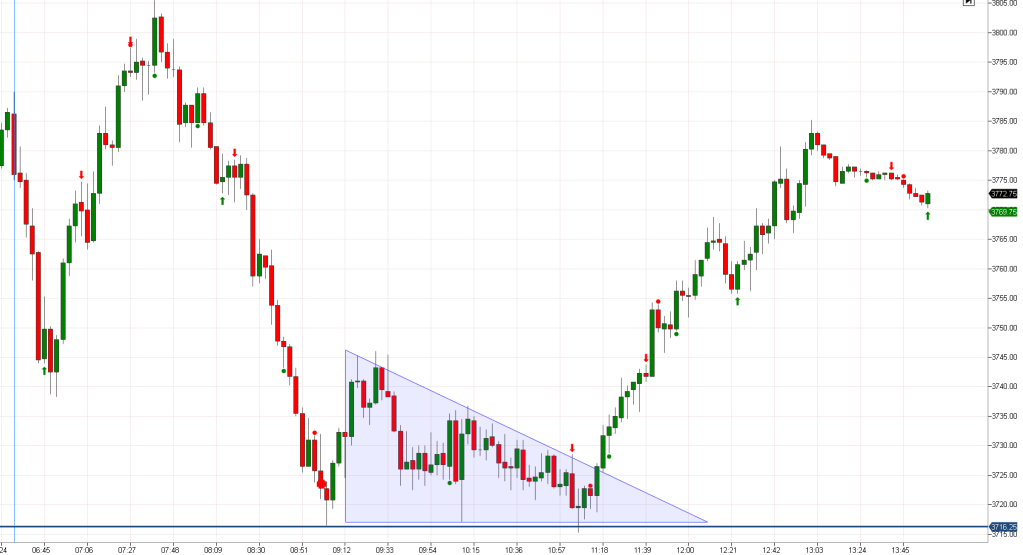
Triangle Reversal Confirmation through footprint chart:
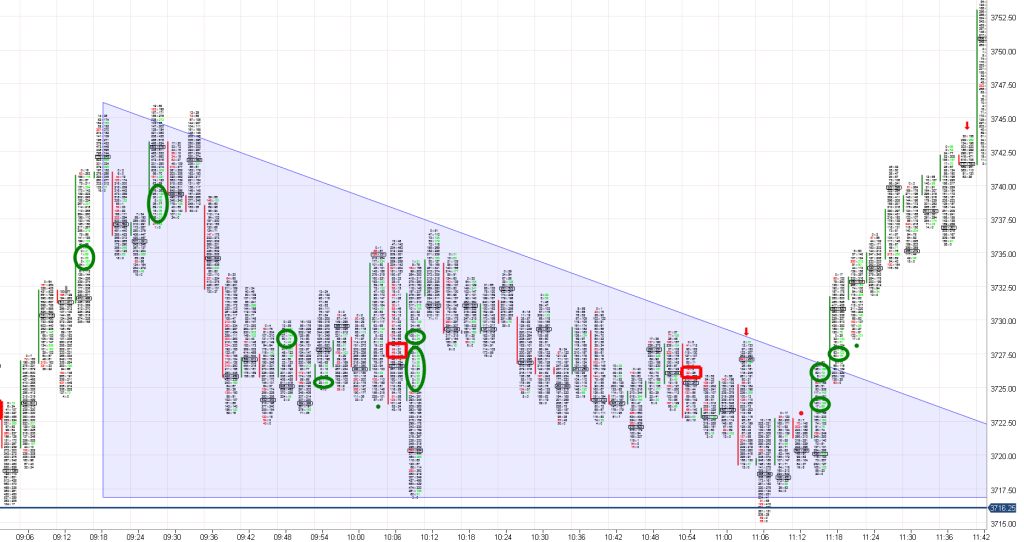
This triangle on the 3-min chart shows the cognitive dissonance that a trader has to endure. Price keeps falling. Toward 11 am we even get a false signal through Delta turnaround, but simply entering a long trade at prior established low 3716.50 (9:03) with a 2 point stop loss would have been enough. I was correct in the fact that after the strong drop until 9 am, there would be a time of consolidation. In this case, it was 2 hours in the shape of a triangle. What signs were there that could have indicated the reversal? Maybe the late Doji?
The footprint chart gives some clues, as price goes down there are a lot of stacked imbalances. On the triangle breakout, there is even a cluster of stacked imbalances. This would have been the last chance to enter a long, there was no opportunity to wait for a retracement. After 2 hours of coiling up, price was ready to move. A long placed at the Doji with a sufficient stop loss would have made the race. But, imagine the agony to endure 2 hours of wait if you had entered at the low of the 9:06 candle! On top of it, it was 11 am and Friday after an emotional trading week with FOMC announcement.
Link to the day: https://martin.travel.blog/2022/11/04/11-04-friday-unemployment/
Confirmation with Delta turnaround.
In this particular trade, I tried to go long at the 50% retracement with the .618 as a stop loss. I entered the trade at the 12:14 mark. Then, the first turnaround signal was green signaling that I was heading in the right direction. Unfortunately, I overlooked the red turnaround signal a few candles further along and got kicked out on the follwing candle. When I see a stacked imbalance or a delta turnaround at that stage in 50% fibonacci trade I should exit immediately. This is only a 1-min chart, but because the prior red turnarounds also indicated a price drop I should have just exited then and there.
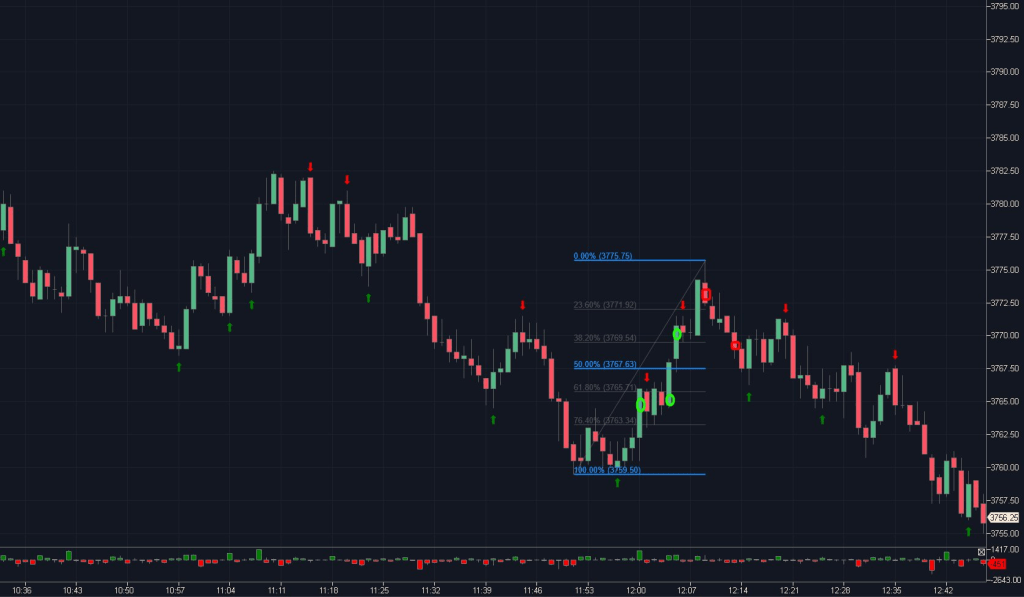
Stacked imbalances’ confirmation example:
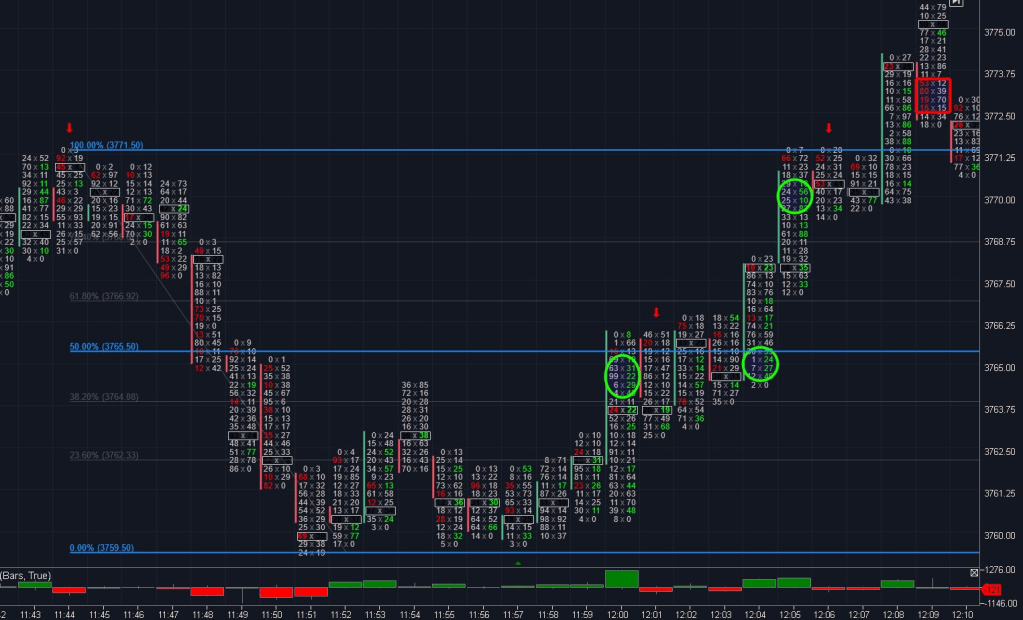
In this case, I went short at the 50% level at the 12 pm candle, but got kicked out at 12:04. It is ok for there to be a stacked imbalance in the first candle at the beginning of the retracement (counter move) but not in the actual candle where I enter the trade. I got kicked out in the 2nd green circle (stacked imbalance.)
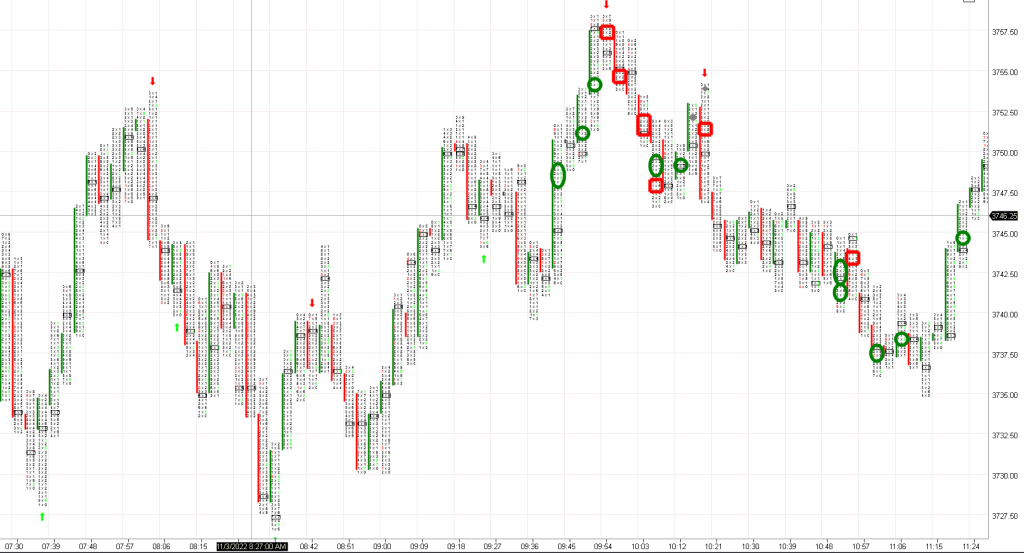
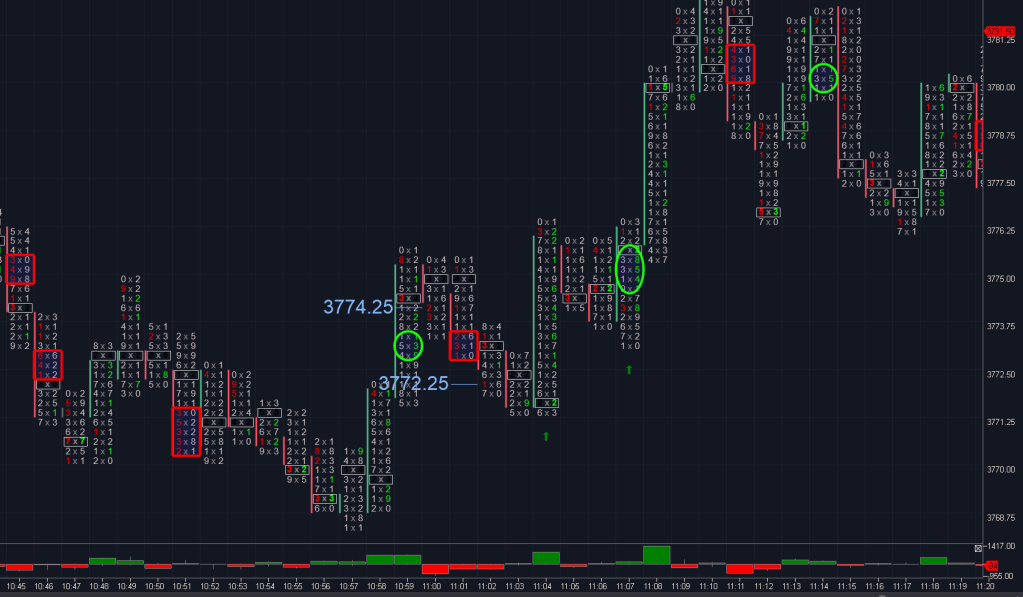
Example Stacked Imbalance/Delta Turnaround
Here i entered a long trade at 11:16 and left at 11:22 candle. The delta turnaround at the candle before my long and the second delta turnaround at the 4th candle after my trade should have made me worry and at least adjust my stop loss to break even. there is also a stacked imbalance not in my favor.
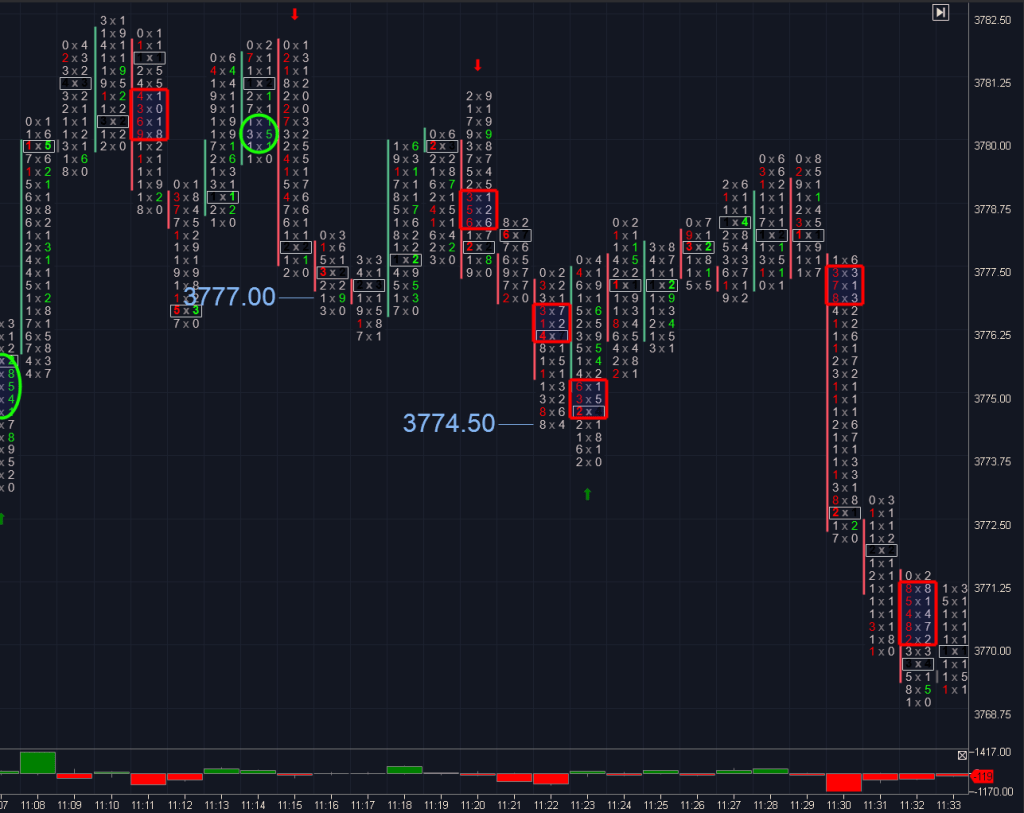
Stacked imbalance example
Entry at 11 am and exit at 11:02 for a long. But, the 11:01 candle has a stacked imbalance! Here, I am out of luck.
