TOP RULES
Always trade what you see on the daily chart of the current day. DO not trade what you think might happen. Always trade what you can prove with evidence.
What is evidence? When the POC is moving up or down we have a trend day, when the POC stays in the same area, we have a range bound day.
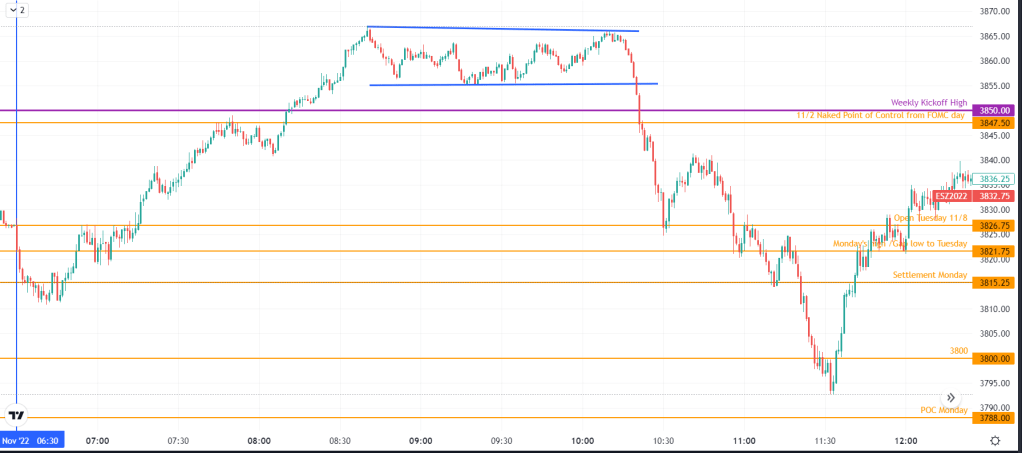
Trade at the extremes on a range bound day and avoid the POC area. If a trend day emerges, POC are can be the last time to enter a long or short before price takes of though. Example: https://www.tradingview.com/x/YSIQEONE/ This was the day after the Midterms and price traded around open until 9 am until it left that area for good. When it left the area around OPEN and POC this would have been a good entry for a short. Price never returned to that area.
If we have a small IB, an upset is likely ensuing a trend day.
If you feel certain about a trade to the point that you feel you can put on a wider stop loss, stop trading immediately, and walk away because anything can happen, and your mind is tricking you into thinking that you are right. You might be right, but since I don’t know everything, it is still possible that the trade will not go my way. Always stick to my strategy. Always set a stop loss and have an idea of where take profit should be for this trade to work out.
I don’t know what is going to happen next!!!
FIVE FUNDAMENTAL RULES
- Anything can happen
- You don’t need to know what is going to happen next in order to make money
- There is a random distribution between wins and losses for any given set of variables that define an edge.
- An edge is nothing more than an indication of a higher probability of one thing happening over another
- Every moment in the market is unique.
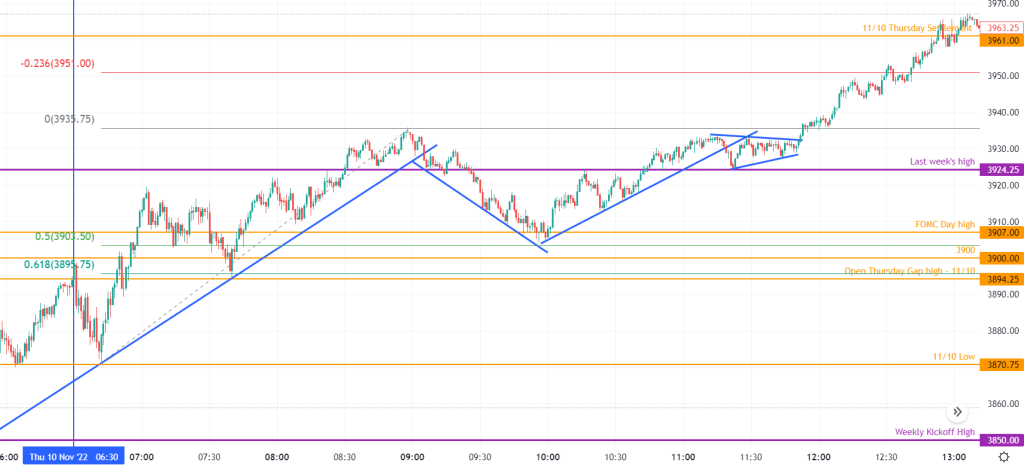
On a day of news like FOMC and Midterms stay patient, don’t trade before the IB is in.
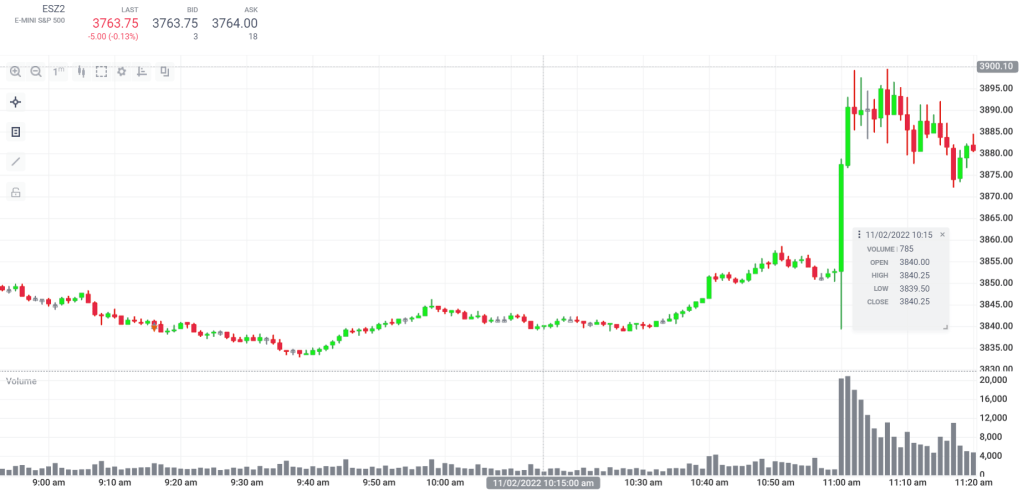
- On days of big news like FOMC announcement or unemployment or CMI, the trading will be small range and nontrend. Major players are sitting on the sideline, they have hedged their positions sufficiently to protect themselves against any major turns the market might take. If the market seems to be favoring one direction or another, I should enter my position well before the announcement, as I will not be able to either enter or sell the one-minute candle of the announcement. In the 11/02 FOMC annoucement the 11 am 1 minute candle was 39.25 points large. My positions should have been to be comfortably (meaning by 40 points) comfortable with the outcome in either direction.
2. Gap Trade
Gap trade is when price opens with a gap from the previous day’s range high. If it closes in
3. Fibonacci Trade
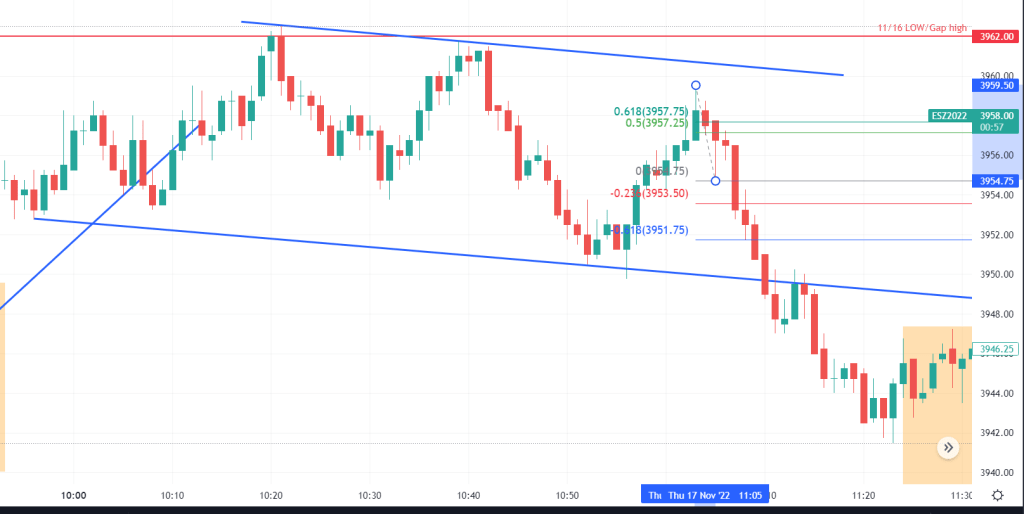
Fibonacci is best suited for trend days. Enter a trade at 50% and set stop loss at .618 or other major resistance/support level that is close by. If we are in a range bound day with news released throughout the day like Midterms or FOMC announcement, Fibonacci might be difficult entry but is a possibility to gauge strength of movement for example price might not come back to 50% retracement signaling a strong trend, or I might get stopped out signaling the trend has ended, and I should look for an entry into the other direction.
3.1 Another Fibonacci Trade Short at the end of falling flag consolidation pattern
Full day: https://martin.travel.blog/2022/11/17/11-17-trend-day/
4. P Shaped Trade
On a day where we have clearly established resistance and support levels on the upside and downside and we are trading sideways, we need to get in on the extremes. Let the extremes establish itself and then get in on a tracement. A low risk retrasement would be if we go all the way up to the .618 level and set the stop loss close or above the upper resistance. The key on a day like this is to wait for the high to establish itself and then trade with the high as a stop loss.
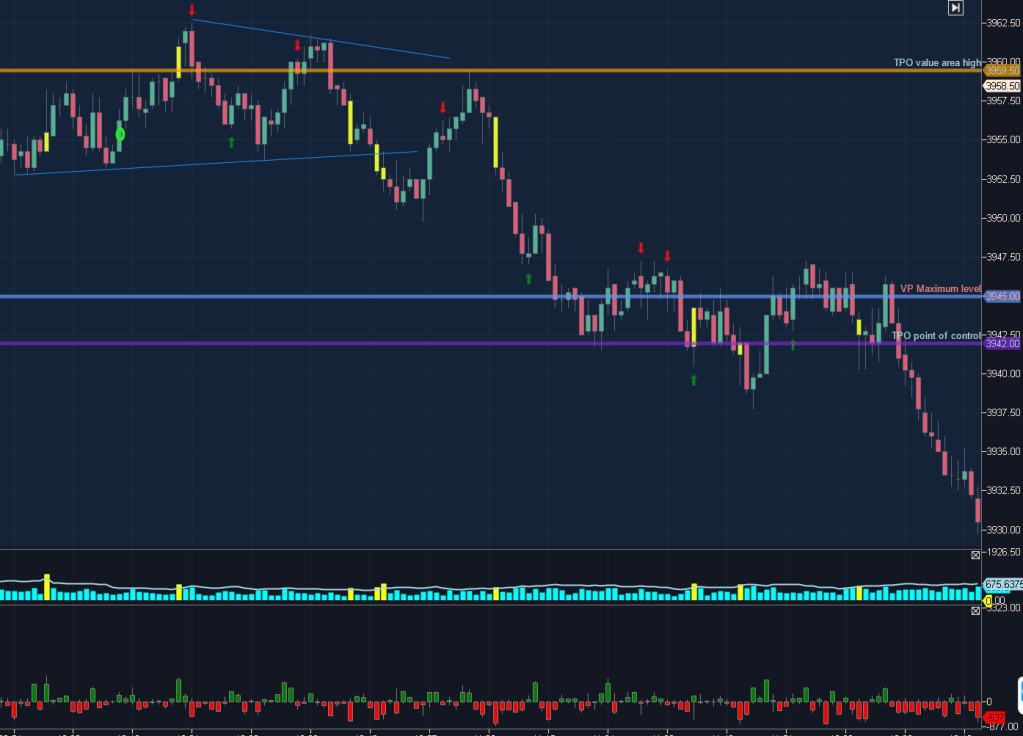
This looked like an up day but actually, the day before was a huge down day and overnight before all saw short selling. Once trading opened we saw testing of upper and lower extremes that never got touched again. The directional conviction is low here as price balances back and forth. That is why you obsolutely, need to enter at the extremes. Since the range is small on a day like this an entry with a 3 point stop loss is possible depending on your target. Watch for a perception in value (news). In this particular example the FOMC meeting was the day before and the gap down from the prior day was not closed and the late spike to the downside was also not touched, indicting that price will stay below the high once established.
The P shape becomes more obvious when looking at the Market Profile:
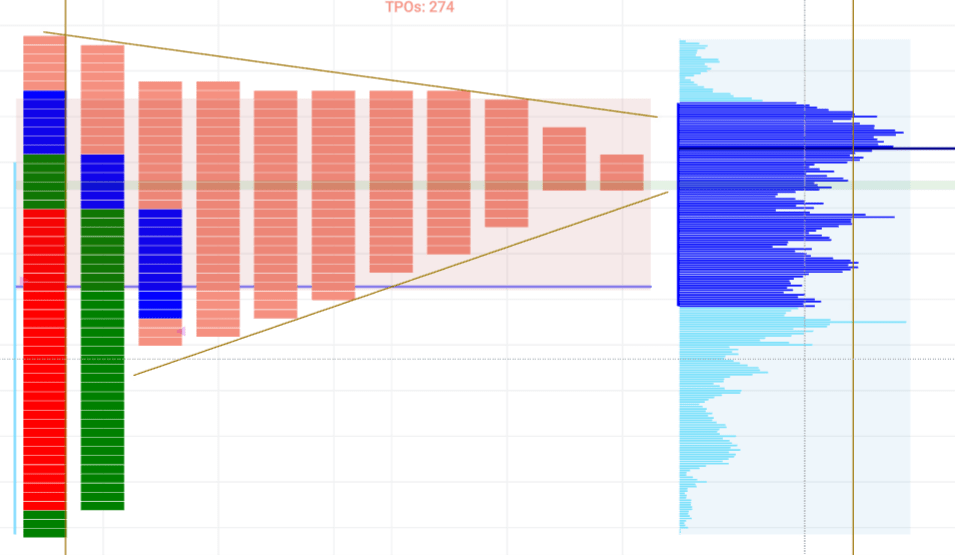
Link to this day: https://martin.travel.blog/2022/11/03/11-03-thursday/
5. Open trade
Link to the day when I explain the opening trade: https://martin.travel.blog/2022/11/04/11-04-friday-unemployment/
6. Leaving a balance area
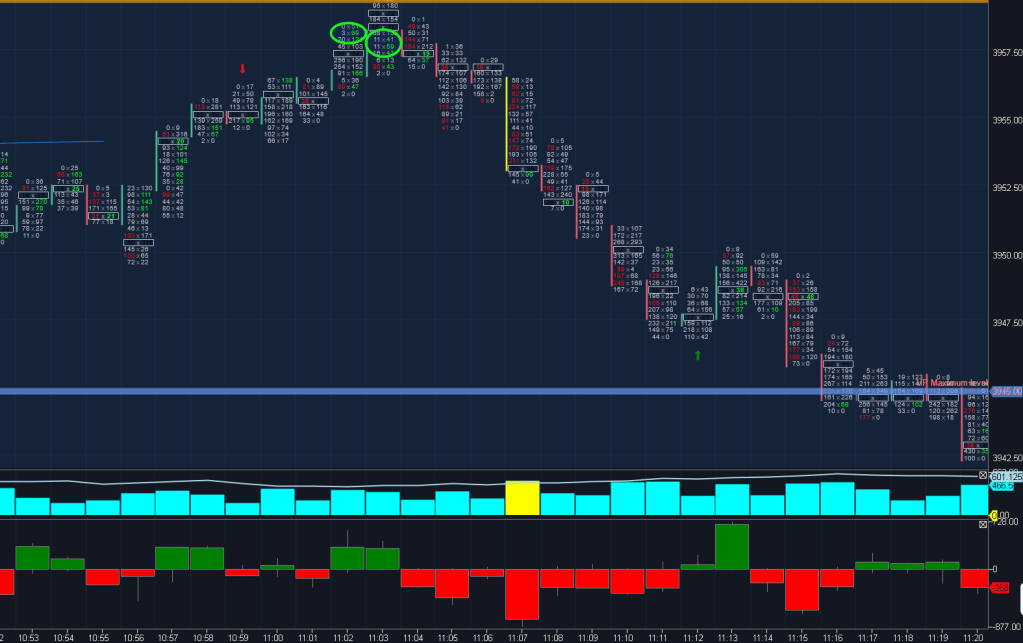
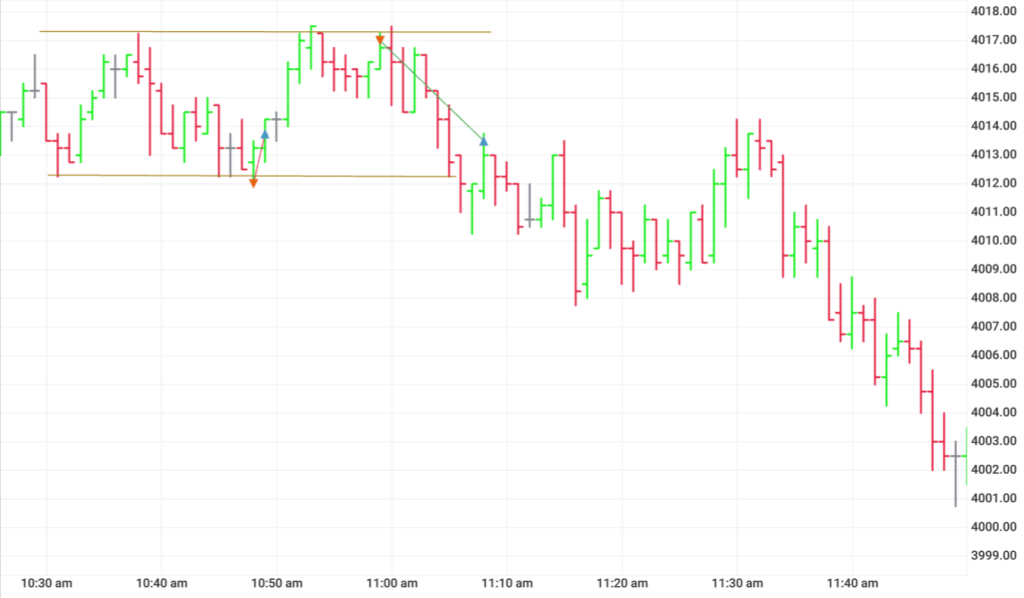
When the price is zigzagging at the extreme of one day like in the image above and the Footprint chart also has stacked imbalances in random directions, then it is best to place a long above and short if price falls below. The only way I lose in this scenario if there is a false breakout which is possible but with a good stop loss I can limit my losses. The important part is that I put a trade in both directions, as I don’t know which way price will go. Once a trade is entered, watch for confirmation. This is an example for a day: https://martin.travel.blog/2022/11/08/11-8-midterm-elections-volatile-news-day/
7. Leaving a balance area/triangle breakout:
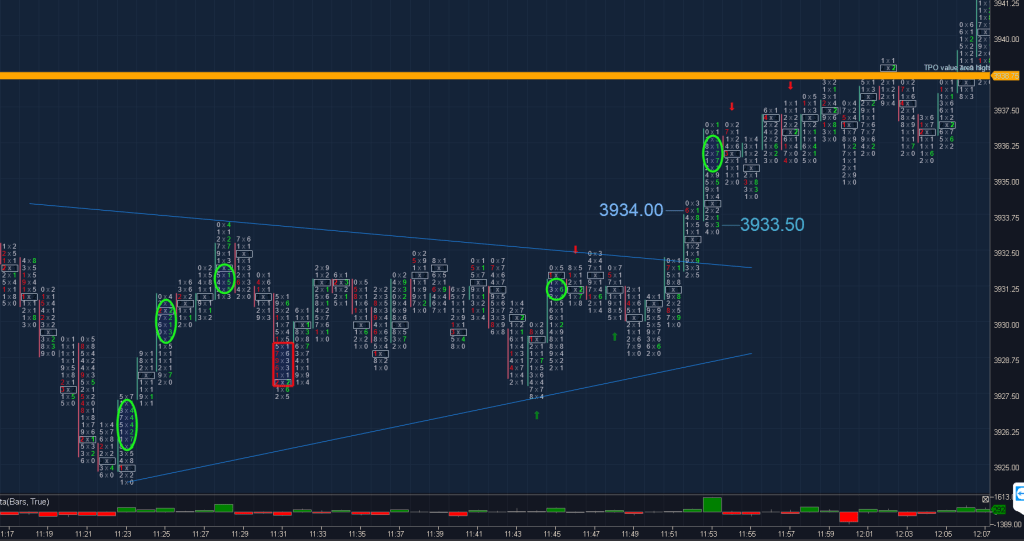
I entered a long as price left the triangle (manually) at 11:52. I was still undecided if price would continue to the upside or reverse at value area high. In the end, price took off. I adjusted my stop loss too short and got kicked out in the next candle. Coincidently, the same candle I got kicked out, there was a stacked imbalance that was in favor of my trade direction. Silly mistake made out of fear. I entered one more long in the same candle but got kicked out, then entered a short that I also got kicked out of. Watch the last video for a recap.
Day that this happened: https://martin.travel.blog/2022/11/10/11-10-cpi-day/
8. Leaving balance area from rectangle
Detailed description (trade 2 &3 video): https://martin.travel.blog/2022/11/15/11-14-22/
Entry at 10:59, exit at 11:08, one stacked imbalance after I entered trade. Delta turnaround did not have any good signals.
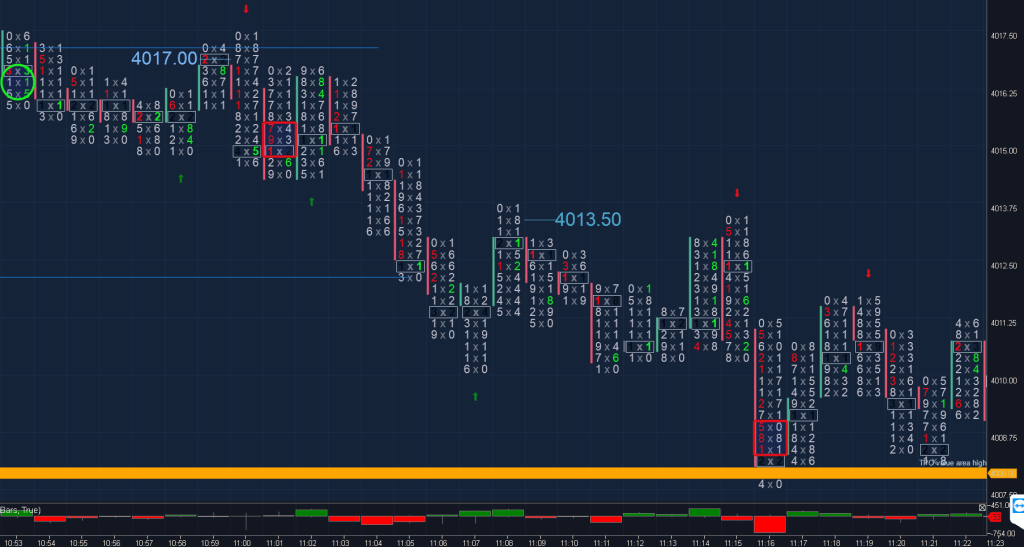
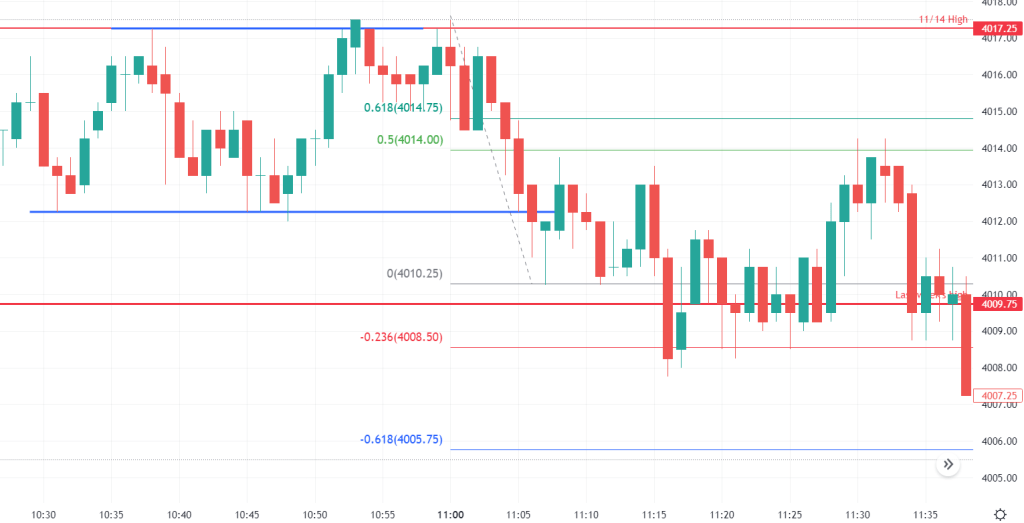
Fibonacci would have helped me not exit the trade prematurely and at least go down to -.236 level and double my profit.
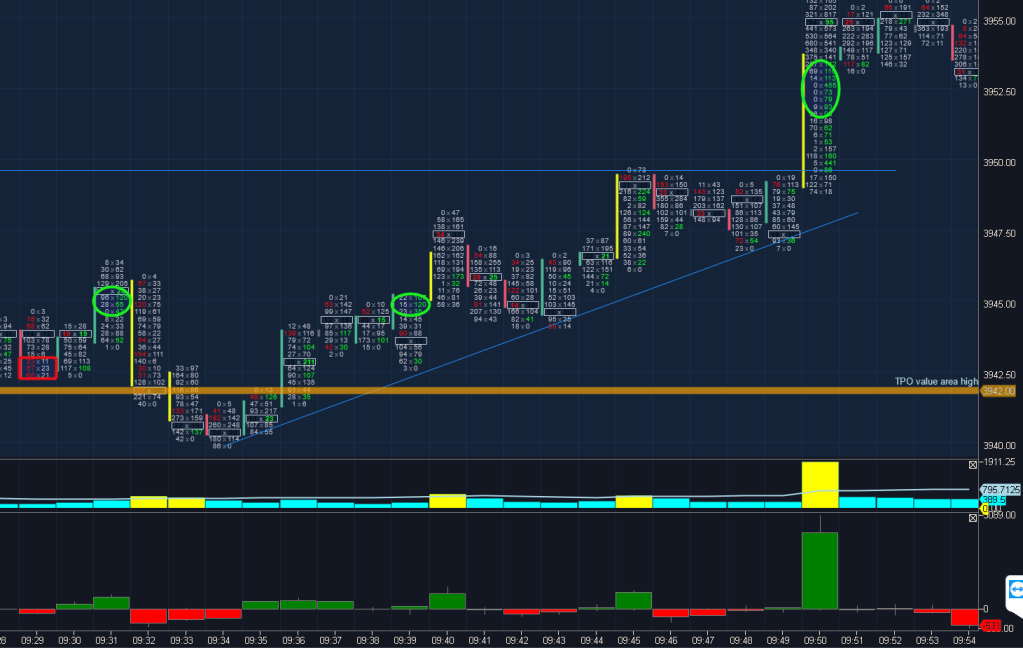
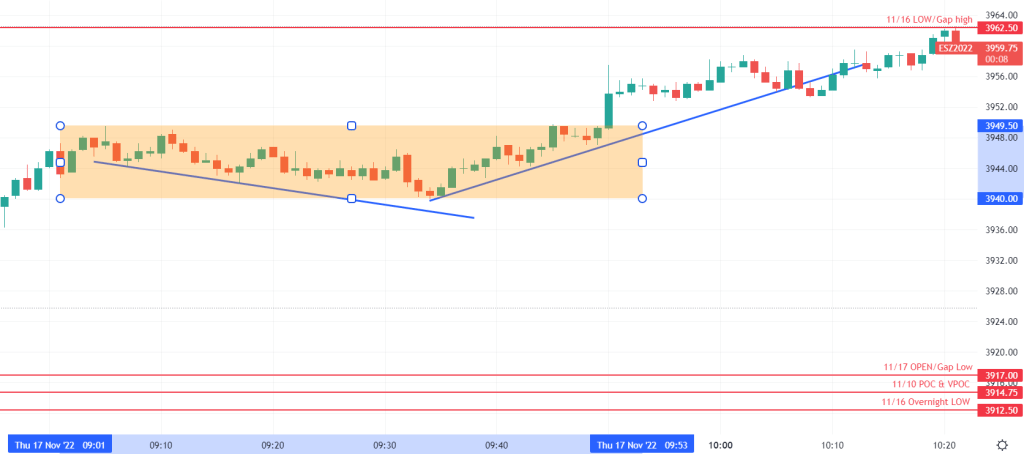
9. Rectangle breakout
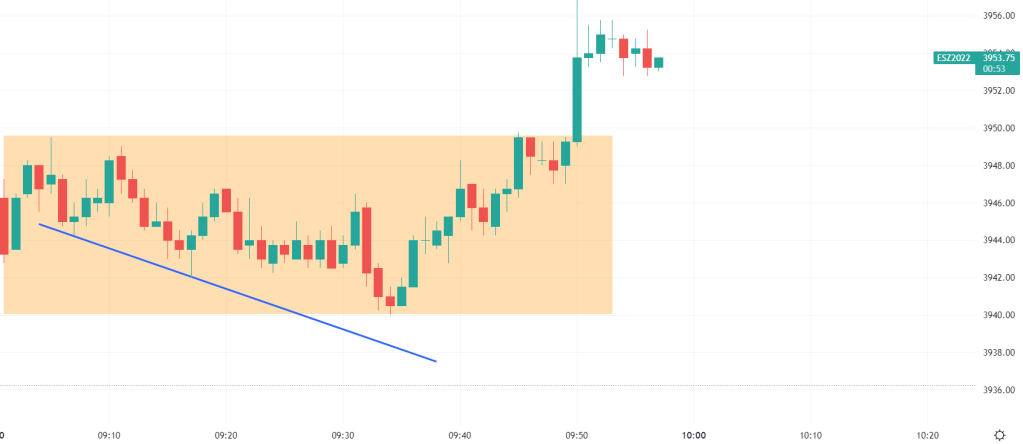
After a strong directional move, price was resting here in this rectangle for about 50 min before breaking out to the upside. When the trend line was not met, this could have been a sign that price is about to turn up. The breakout could have been entered one or two ticks above the most recent high with a stop loss at the level of the upward sloping trendline, in this case 2.5 points. A take profit of 5-7 points immediately entered would have secured my spot in case price is about to return afterwards.
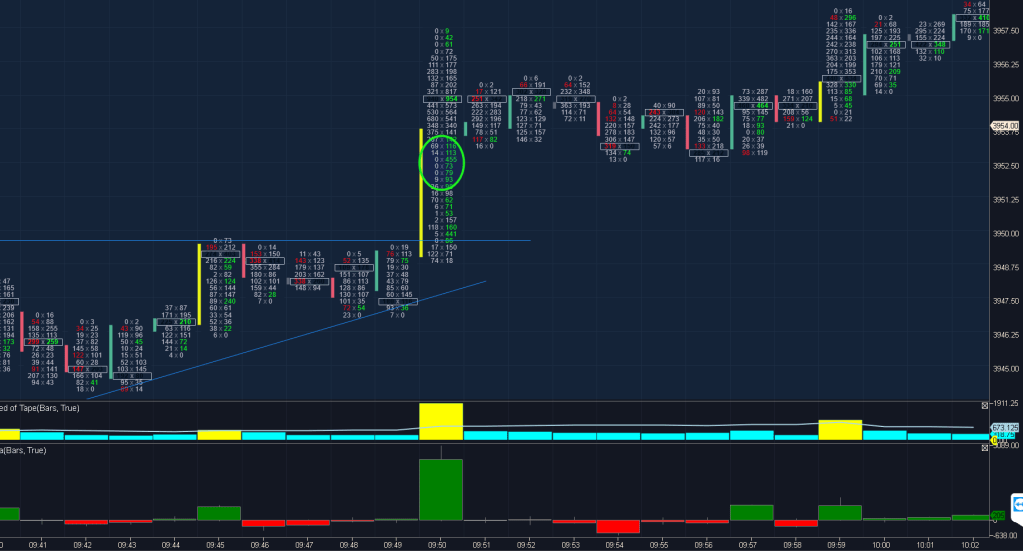
Here is another look at when we could have gone long, the 9:34 and 9:35 candle did not reach the lower blue trendline yet the rectangle expanded downward. Going long here with a small stop loss would have been a low risk entry.
Fibonacci would have barely gotten me in here. The change in perception with Delta was obvious, though. 3 times red and 3 time green.