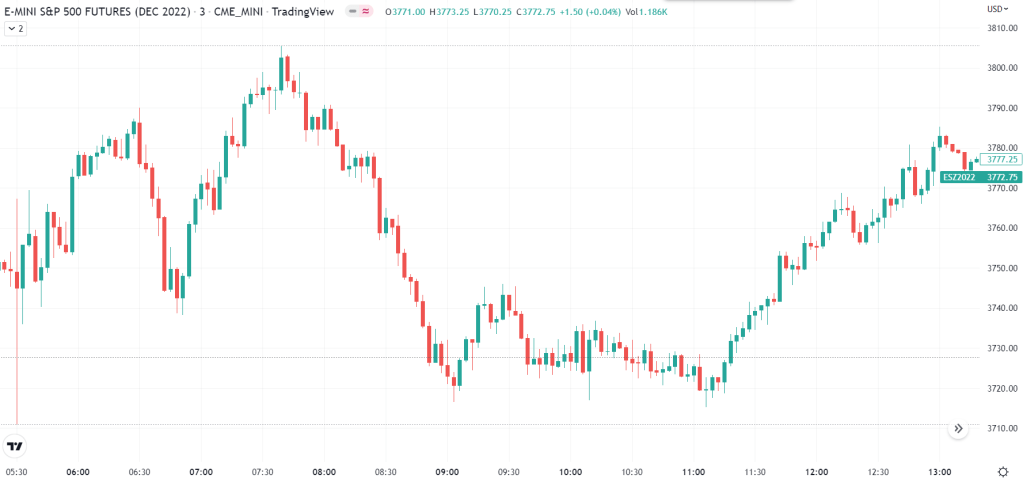
Unemployment was released at 5:30 AM PT and the market has been ripping higher since. We are now out of range and out of balance already from yesterday, and are looking to open with a gap from yesterday and within Thursday’s range.
After four straight down days, this could be a relief day. Unemployment number came in slightly worse than expected but still good with 3.7 instead of the projected 3.5.
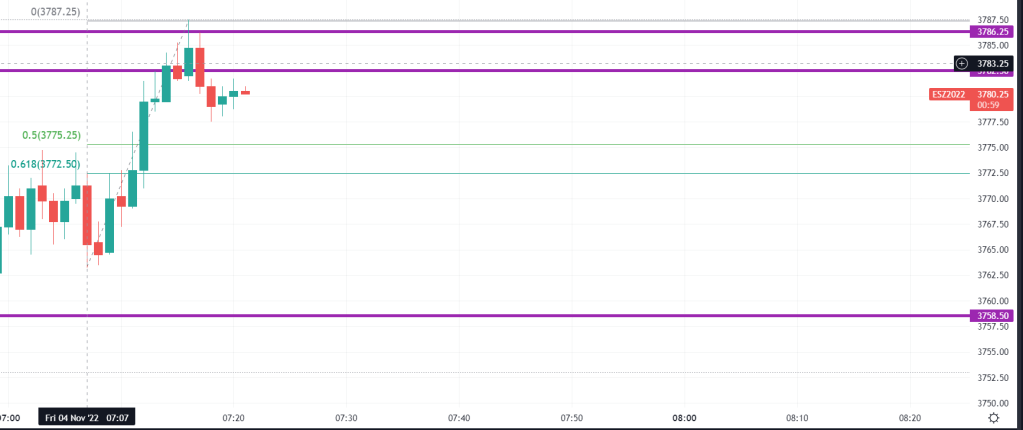
OPEN 3786.25
Trade 1 Opening Trade
After the night had a lot of longs and a knee-jerk move around 5:30 am when unemployment was released, we saw an overnight range of 76.25 as opposed to 54.24 point range during daytime. I entered a short after the first 1-min candle left to the downside. I exited the short too early, unfortunately, due to the anxiety created by deleting the wrong order lines and accidentally deleting my stop loss. There was one green candle that did not retrace to 50% though, I should have stayed in and need to learn how to manually add a stop loss so as not to get confused when multiple order lines are on the chart.
Trade 2 Fibonacci Retracement at the 50% retracement with .618 as a stop loss, made sure that the stop is sufficient with 12 ticks. Price did not retrace this far down and I did not take this trade.
Previously, price tested back down to 3738.25 low at 6:48 and reversed. That is still 10 points above settlement from yesterday (3727). Now hovering at OPEN price 3786.25 again at 7:25. This Fibonacci retracement did not get filled because price took off. The high was
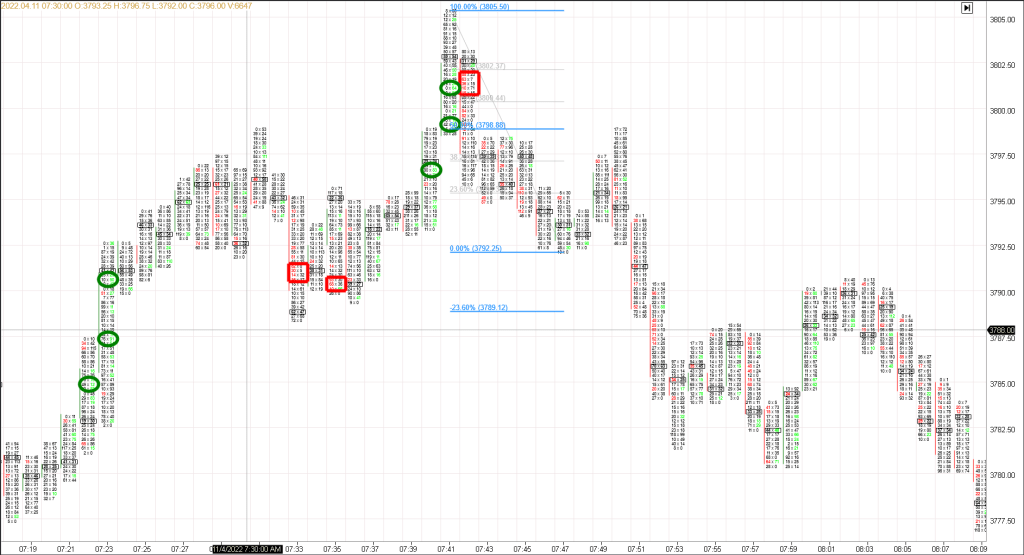
The POC is now at 3781.50. The IB is 60 points wide and argues for a range bound day with little upset to the upside or downside. We had two ranges extension two the upside so far in B and C period. We have also traded through the Gap high at 3766.75 that was left by the low from the big down day on Wednesday FOMC day (11/02) to Thrusday’s. We also traded up and beyond the 3782.5 late spike left by Wednesday’s emotional down day after the FOMC announcement. High of the day is 8505.50
At 8:48 we are now below the low that was established earlier 3737 and in range extension to the downside, we keep extending lower to settlement from yesterday at 3727. At 9:05 price is now testing overnight low at 3711 from 5:30 am when the unemployment number was released. My assumption from having a range bound day is null. We are having range extensions on both sides of the IB. Price might drop to 3700 level. At 9:06 price seems to have bottomed out at 3716.50, did not reach overnight low of 3711.
This would have been a good trade entry at 50% right after price bottomed out at 3716.50. I did not take it. Scared of the range extension to the downside. Are we going further down?
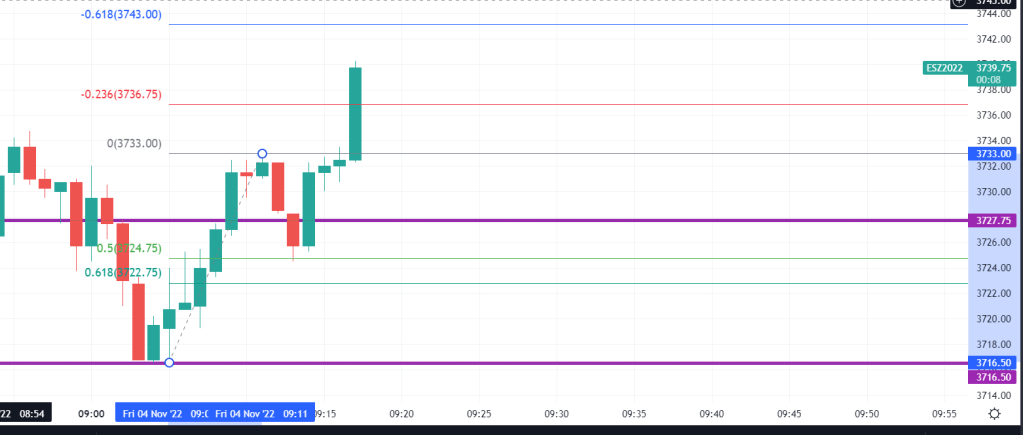
Would have been a nice trade and carried us to -.618 as seen below.
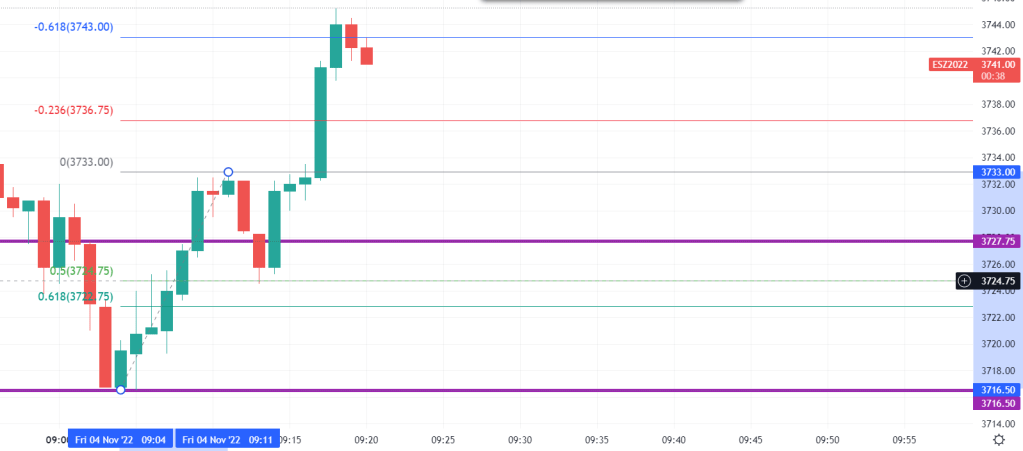
10 am: POC dropped from 3781.5 to 3763.50 and looks like to be spending time at 3727.75 the settlement from Thursday. 3758.50 is the POC at the end of the day.
The volume profile shows that a lot of time was spent close to the settlement of yesterday. VPOC is 3726.50 and POC is higher at 3758.50. Settlement was at 3779.50 which is just 7 points below open. Overall, due to the strong overnight activity, we are finishing the day with overlapping to higher value. That confirms we are in somewhat of an area of balance at the current state after Thursday’s strong down day, and value is being accepted lower. This week saw 4 down days and today was the only up day.
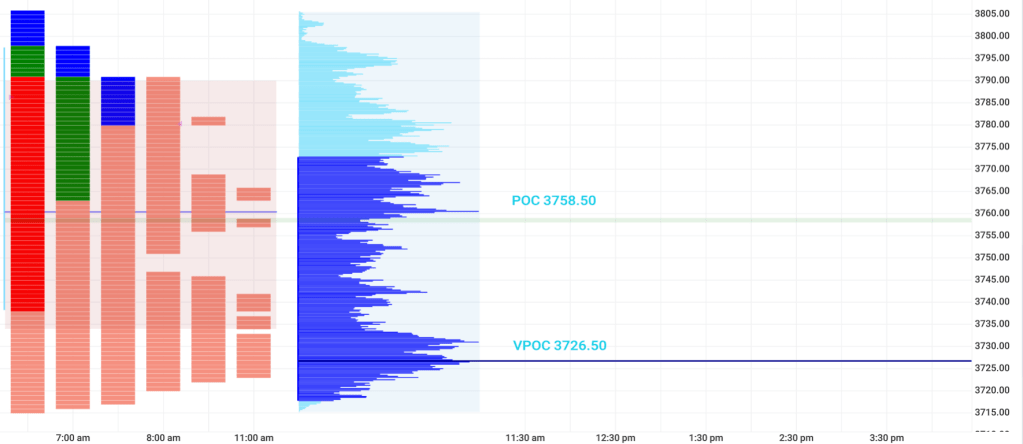
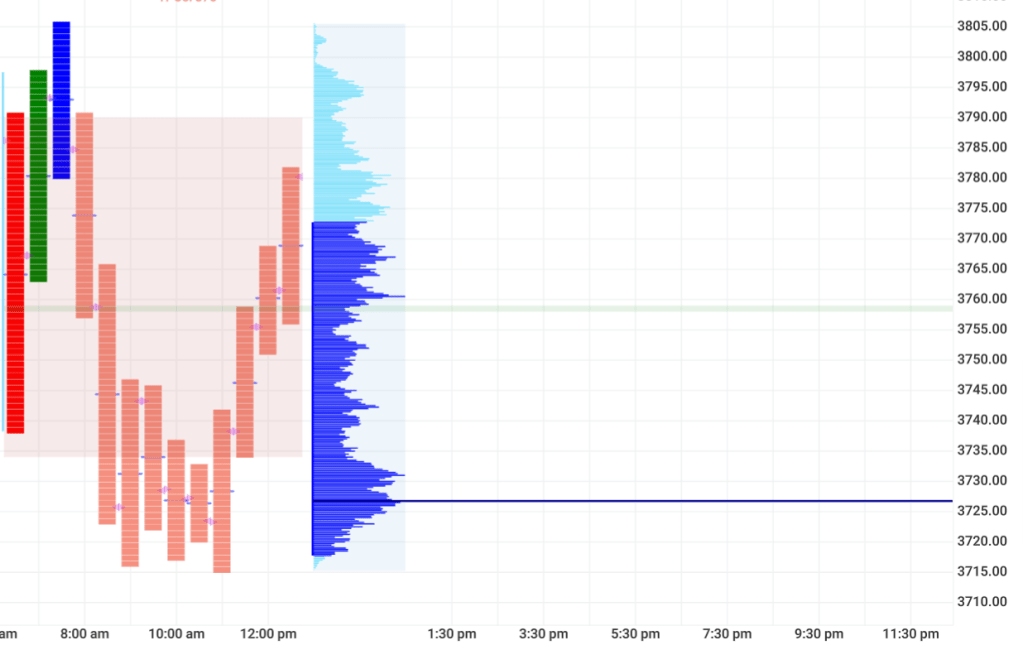
The split Market Profile shows that we had two range extensions on either side, the overnight low was not reached, yet. On the other side, the POC kept moving downward. All signs were pointing to an extension further downwards towards the 3700 level.
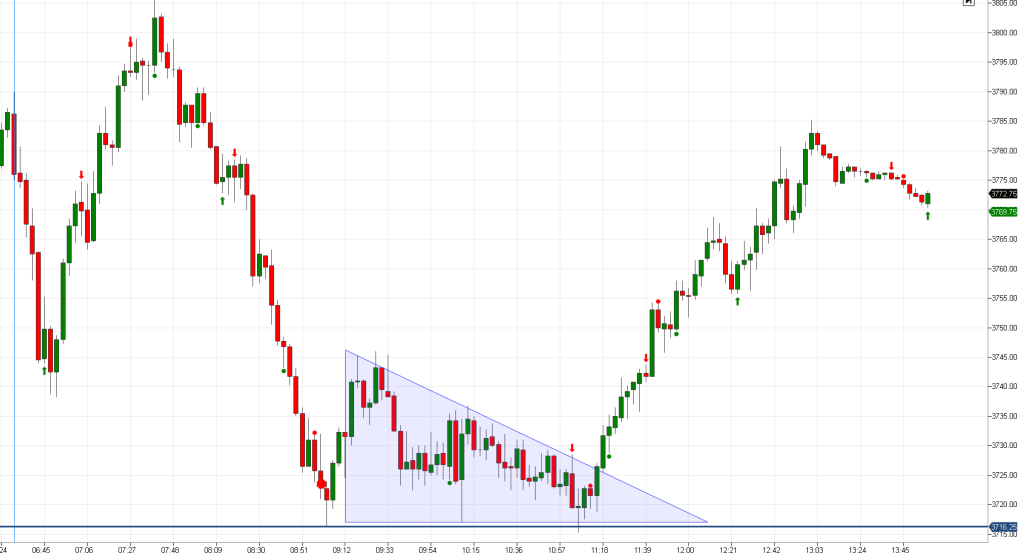
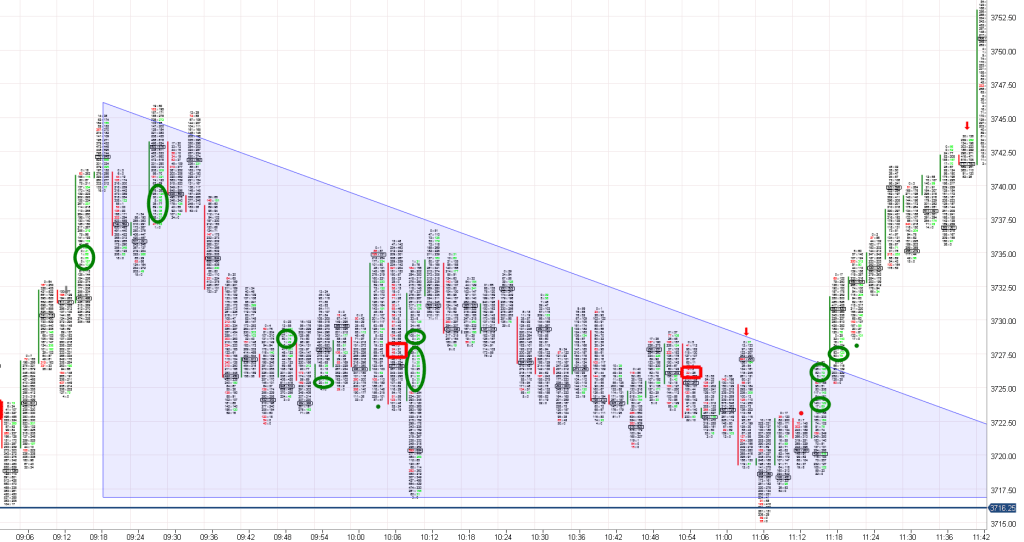
This triangle on the 3-min chart shows the cognitive dissonance that a trader has to endure. Price keeps falling. Toward 11 am we even get a false signal through Delta turnaround, but simply entering a long trade at prior established low 3716.50 (9:03) with a 2 point stop loss would have been enough. I was correct in the fact that after the strong drop until 9 am, there would be a time of consolidation. In this case, it was 2 hours in the shape of a triangle. What signs were there that could have indicated the reversal? Maybe the late Doji?
The footprint chart gives some clues, as price goes down there are a lot of stacked imbalances. On the triangle breakout, there is even a cluster of stacked imbalances. This would have been the last chance to enter a long, there was no opportunity to wait for a retracement. After 2 hours of coiling up, price was ready to move. A long placed at the Doji with a sufficient stop loss would have made the race. But, imagine the agony to endure 2 hours of wait if you had entered at the low of the 9:06 candle! On top of it, it was 11 am and Friday after an emotional trading week with FOMC announcement.
Key takeaways:
-be ready for an open trade when the overnight range is disproportional big, practice trade in the practice account before open
Trade entry at the upper extreme (3805.50) with Fibonacci and Footprint charts as a confirmation:
Image showing how stacked imbalances were mostly on the bid side and as we get closer to the high @3805.50 we are seeing two red stacked imbalances on the Ask, a sign of a trend change. Another red stacked imbalance right after the high candle which still had three green stacked imbalances indicates that now the sellers have showed up. Yet, we don’t jump ahead of the train, but wait for a 50% retracement to make sure the trend is confirmed. A short entry at, 3799 the 50% retracement would have been perfect!